FIGURE 5.
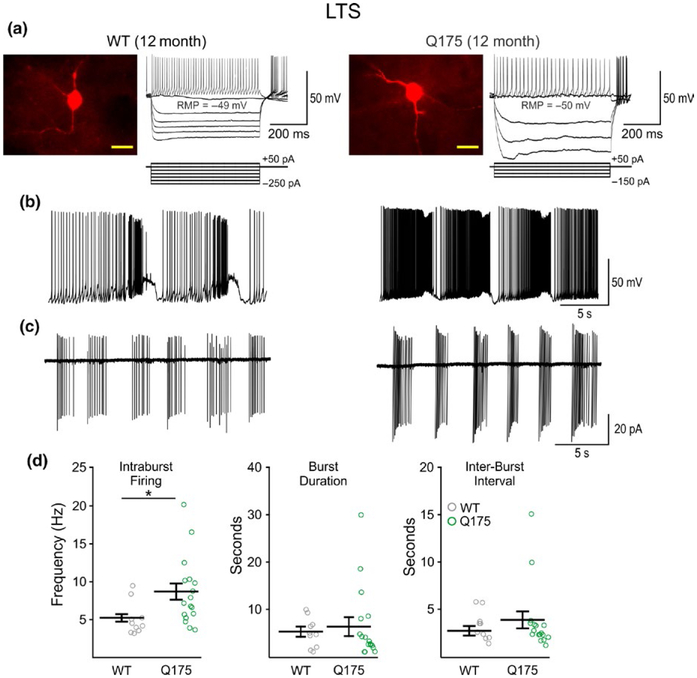
Firing frequency of LTS interneurons from WT and symptomatic Q175 mice. (a) Confocal images of biocytin-filled LTS interneurons and sample responses of these cells to hyperpolarizing and depolarizing current injection in 12-month WT (left) and Q175 (right) mice. The fluorescence from cell somata was saturated to enhance the resolution of processes. Scale bar = 20 μm. (b) When recording in current-clamp mode, a subpopulation of constitutively active cells burst rhythmically with up/down firing states. (c) Burst-firing was also seen in LTS interneurons when recording in cell-attached mode. (d) Summary plots of LTS interneuron firing properties at 12 months. There was a significant increase in the average intraburst firing frequency in bursting cells from symptomatic Q175 mice compared to WTs, whereas no differences were seen in burst durations or interburst intervals.

