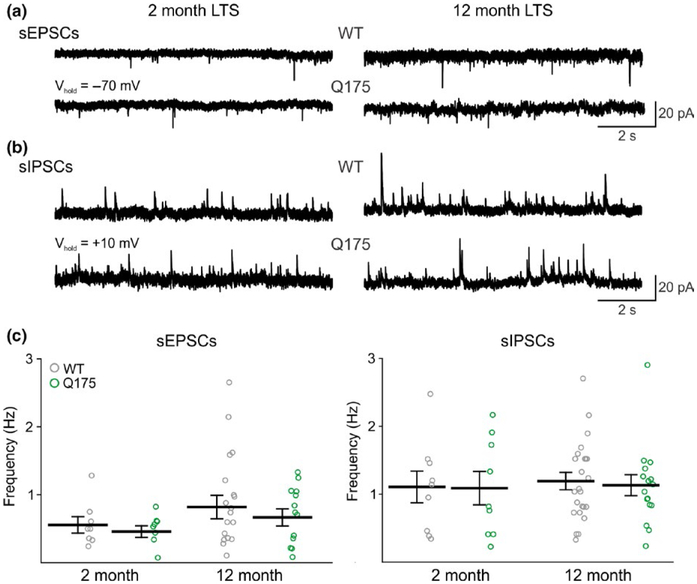
FIGURE 6.
Frequency of synaptic inputs onto LTS interneurons in Q175 and WT mice. (a) and (b) Sample traces of sEPSCs and sIPSCs from LTS interneurons in 2- and 12-month WT and Q175 mice, respectively. (c) and (d) Summary plots showing the frequencies of sEPSCs (c) and sIPSCs (d) observed in WT and Q175 LTS interneurons from 2- and 12-month WT and Q175 mice.

