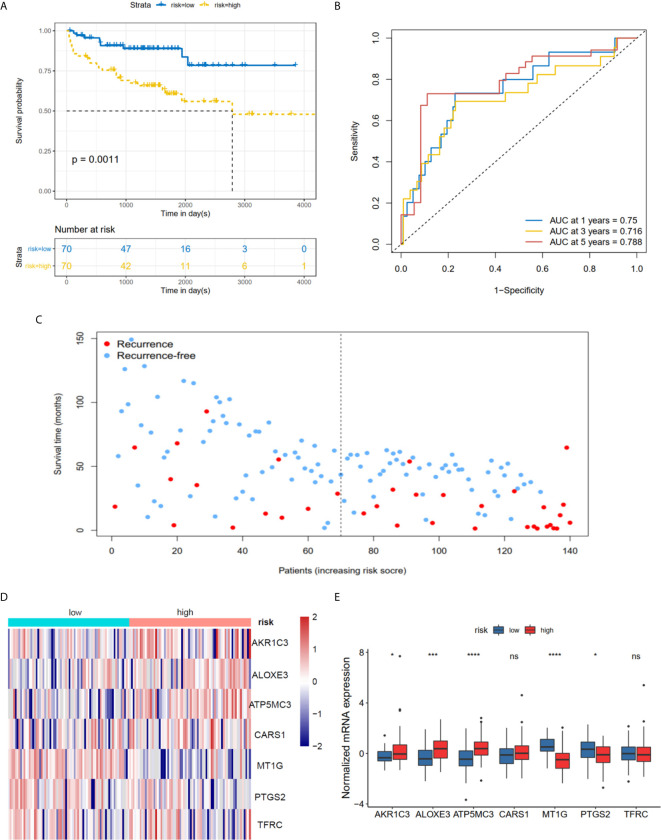
Figure 4.
Risk score based on seven hub FRGs in MSKCC PRAD cohort. (A) Survival analysis according to risk score. (B) ROC analysis. (C) Survival status of patients. (D, E) Heatmap and barplot of the seven hub genes between high and low risk group. All the survival analysis are based on the recurrence free survival data. *P < 0.05, ***P < 0.001, ****P < 0.0001. ns, not significant.

