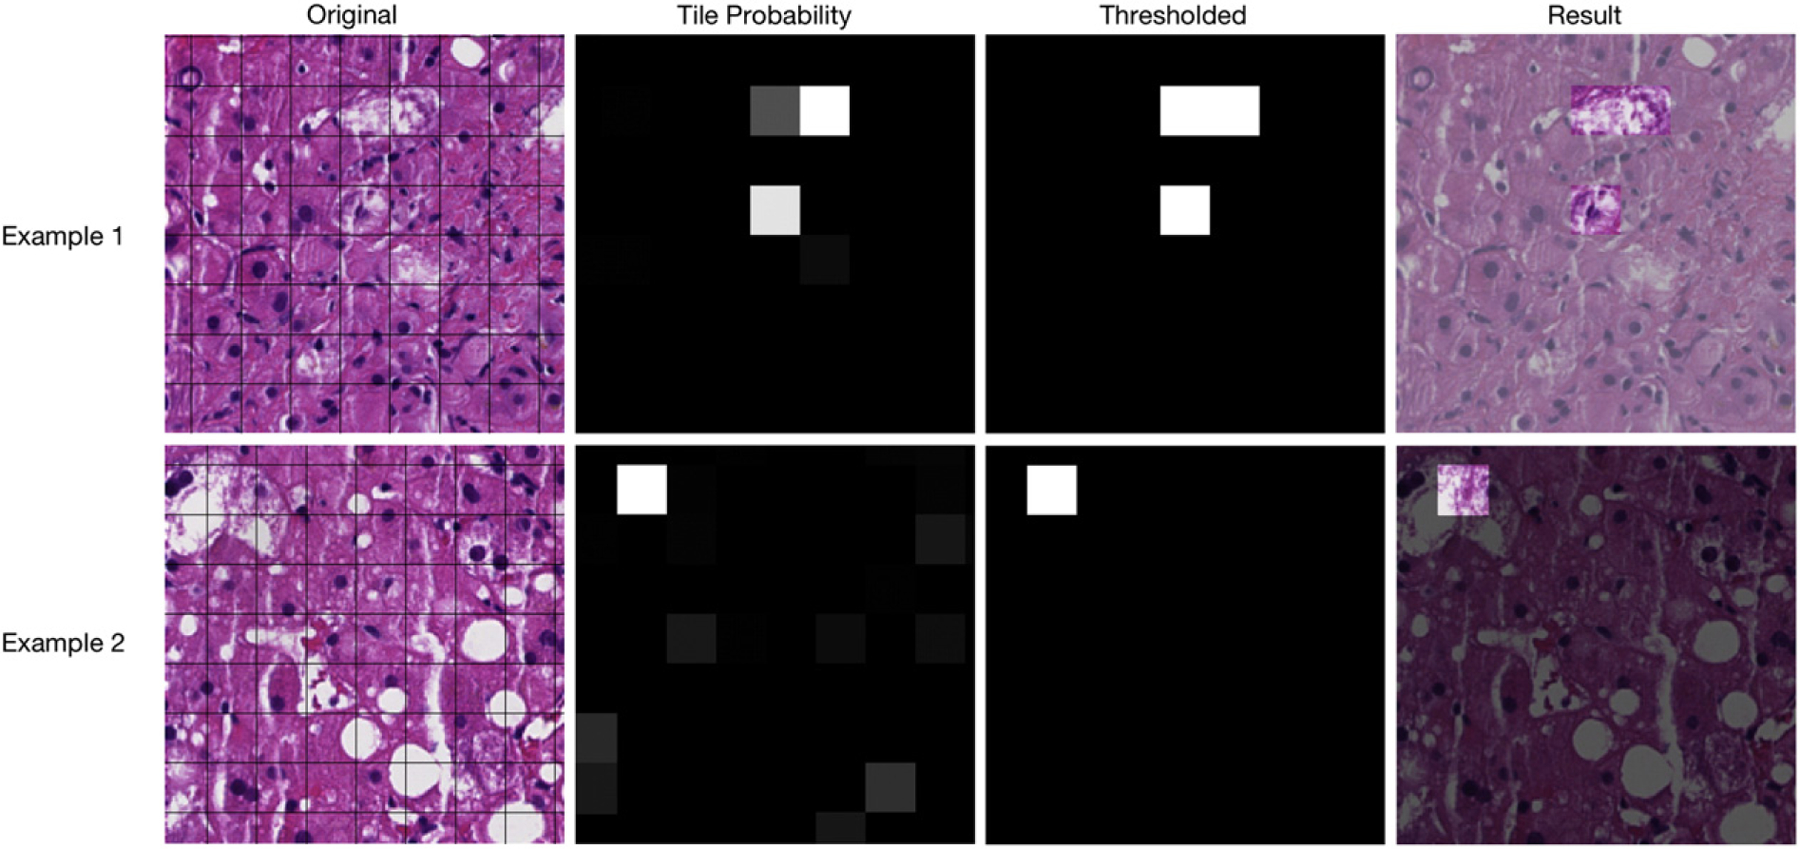
Fig. 1.

The process of identifying hepatocyte ballooning. Actual results and tiles are shown for 2 different biopsy sections. Original scanned images are first divided into tiles. Each tile is assigned a probability of containing hepatocyte ballooning (black is a probability of 0, middle gray is 50%, and white is 100%). Last, a threshold is determined for what probability is required for a tile to be automatically classified as hepatocyte ballooning.
