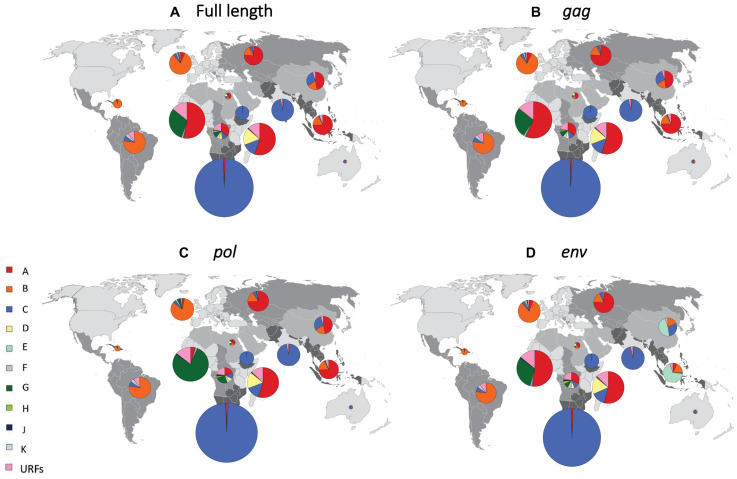
FIGURE 2.
Regional distribution of HIV-1 subtypes after reassignment of CRFs to “pure” HIV-1 subtypes. Regional proportions of HIV-1 subtypes after reassignment of CRFs to “pure” HIV-1 subtypes, based on full-length sequence (A), gag (B), pol (C), and env (D). We grouped all countries into 14 regions, as previously described (Hemelaar et al., 2019). Individual regions are shaded differently on the world map. The proportion of HIV infections attributed to each subtype in each region is shown in pie charts superimposed onto the regions. The sizes (surface area) of the pie charts for each region are proportional to the relative number of people living with HIV in each region. URF, unique recombinant form. Data underlying this figure is displayed in Supplementary Material, pp. 8–10.

