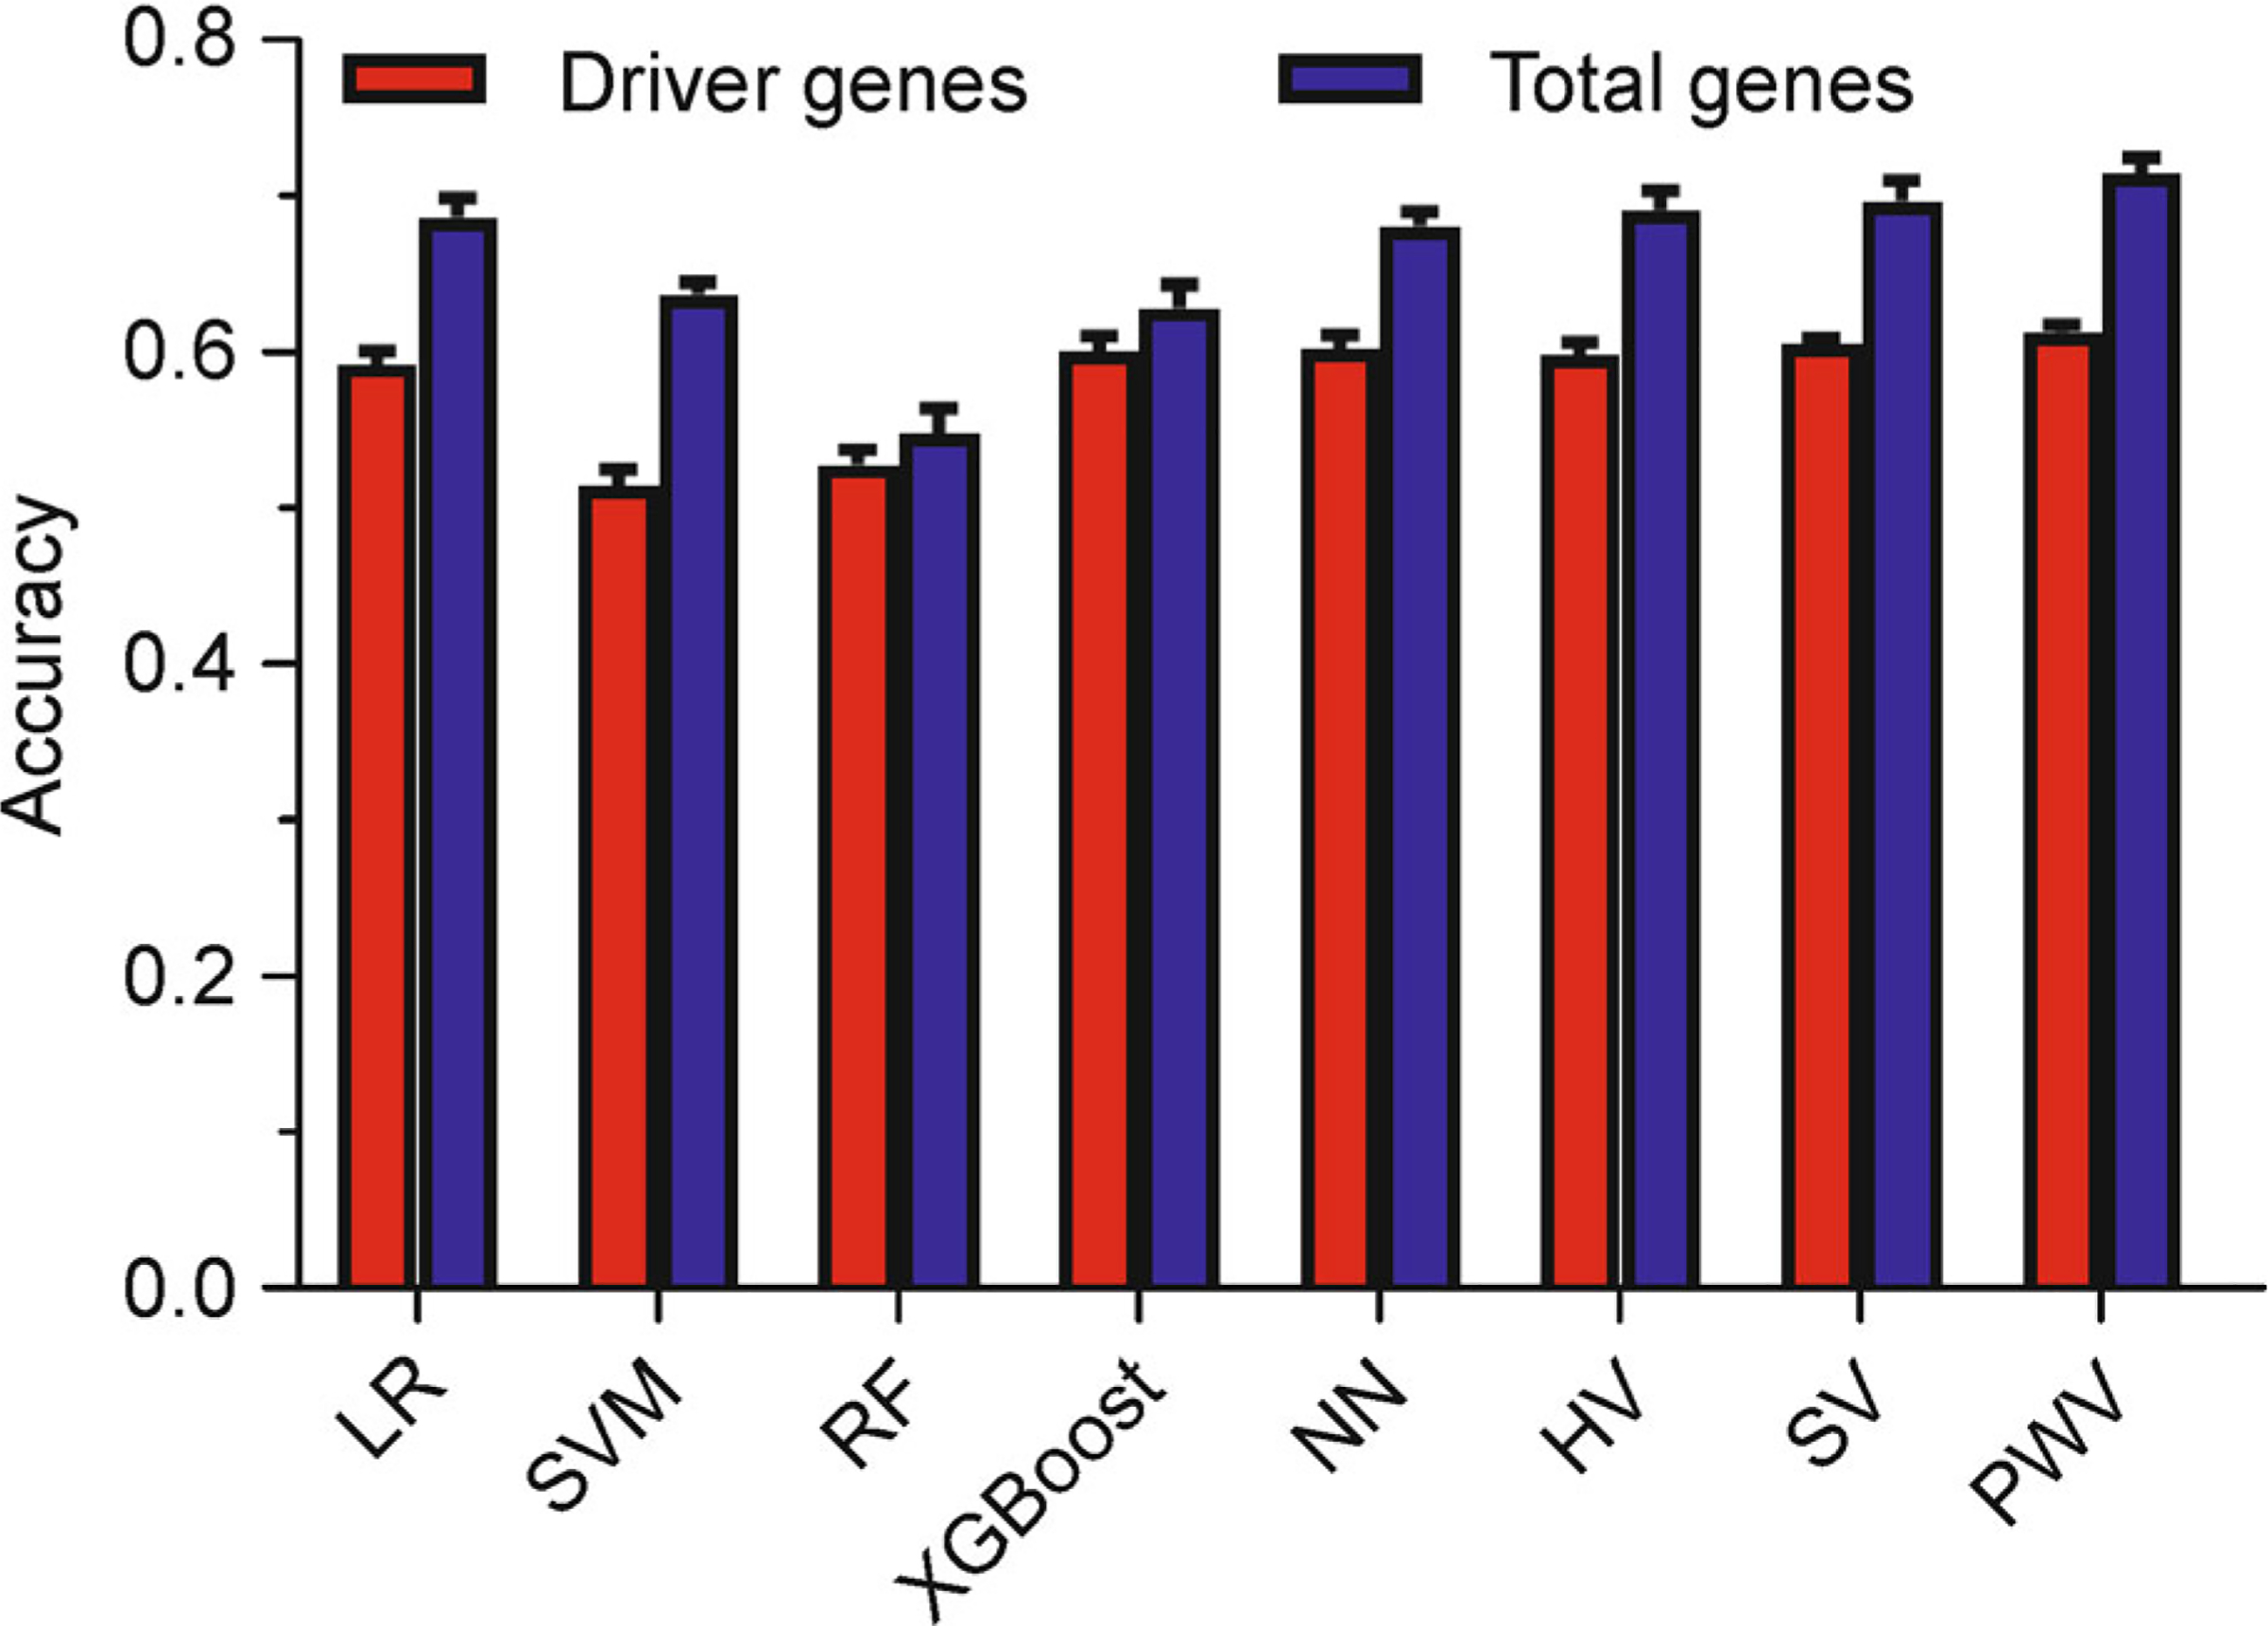
Figure 5. The overall accuracy of the input features using driver genes and total genes.

201 driver genes (red bar) were extracted in comparison with total genes (blue bar). Both of the two gene sets were used as input features to predict the cancer types by the eight models. The height of each bar represents the average number, and the error bar is the standard deviation.
