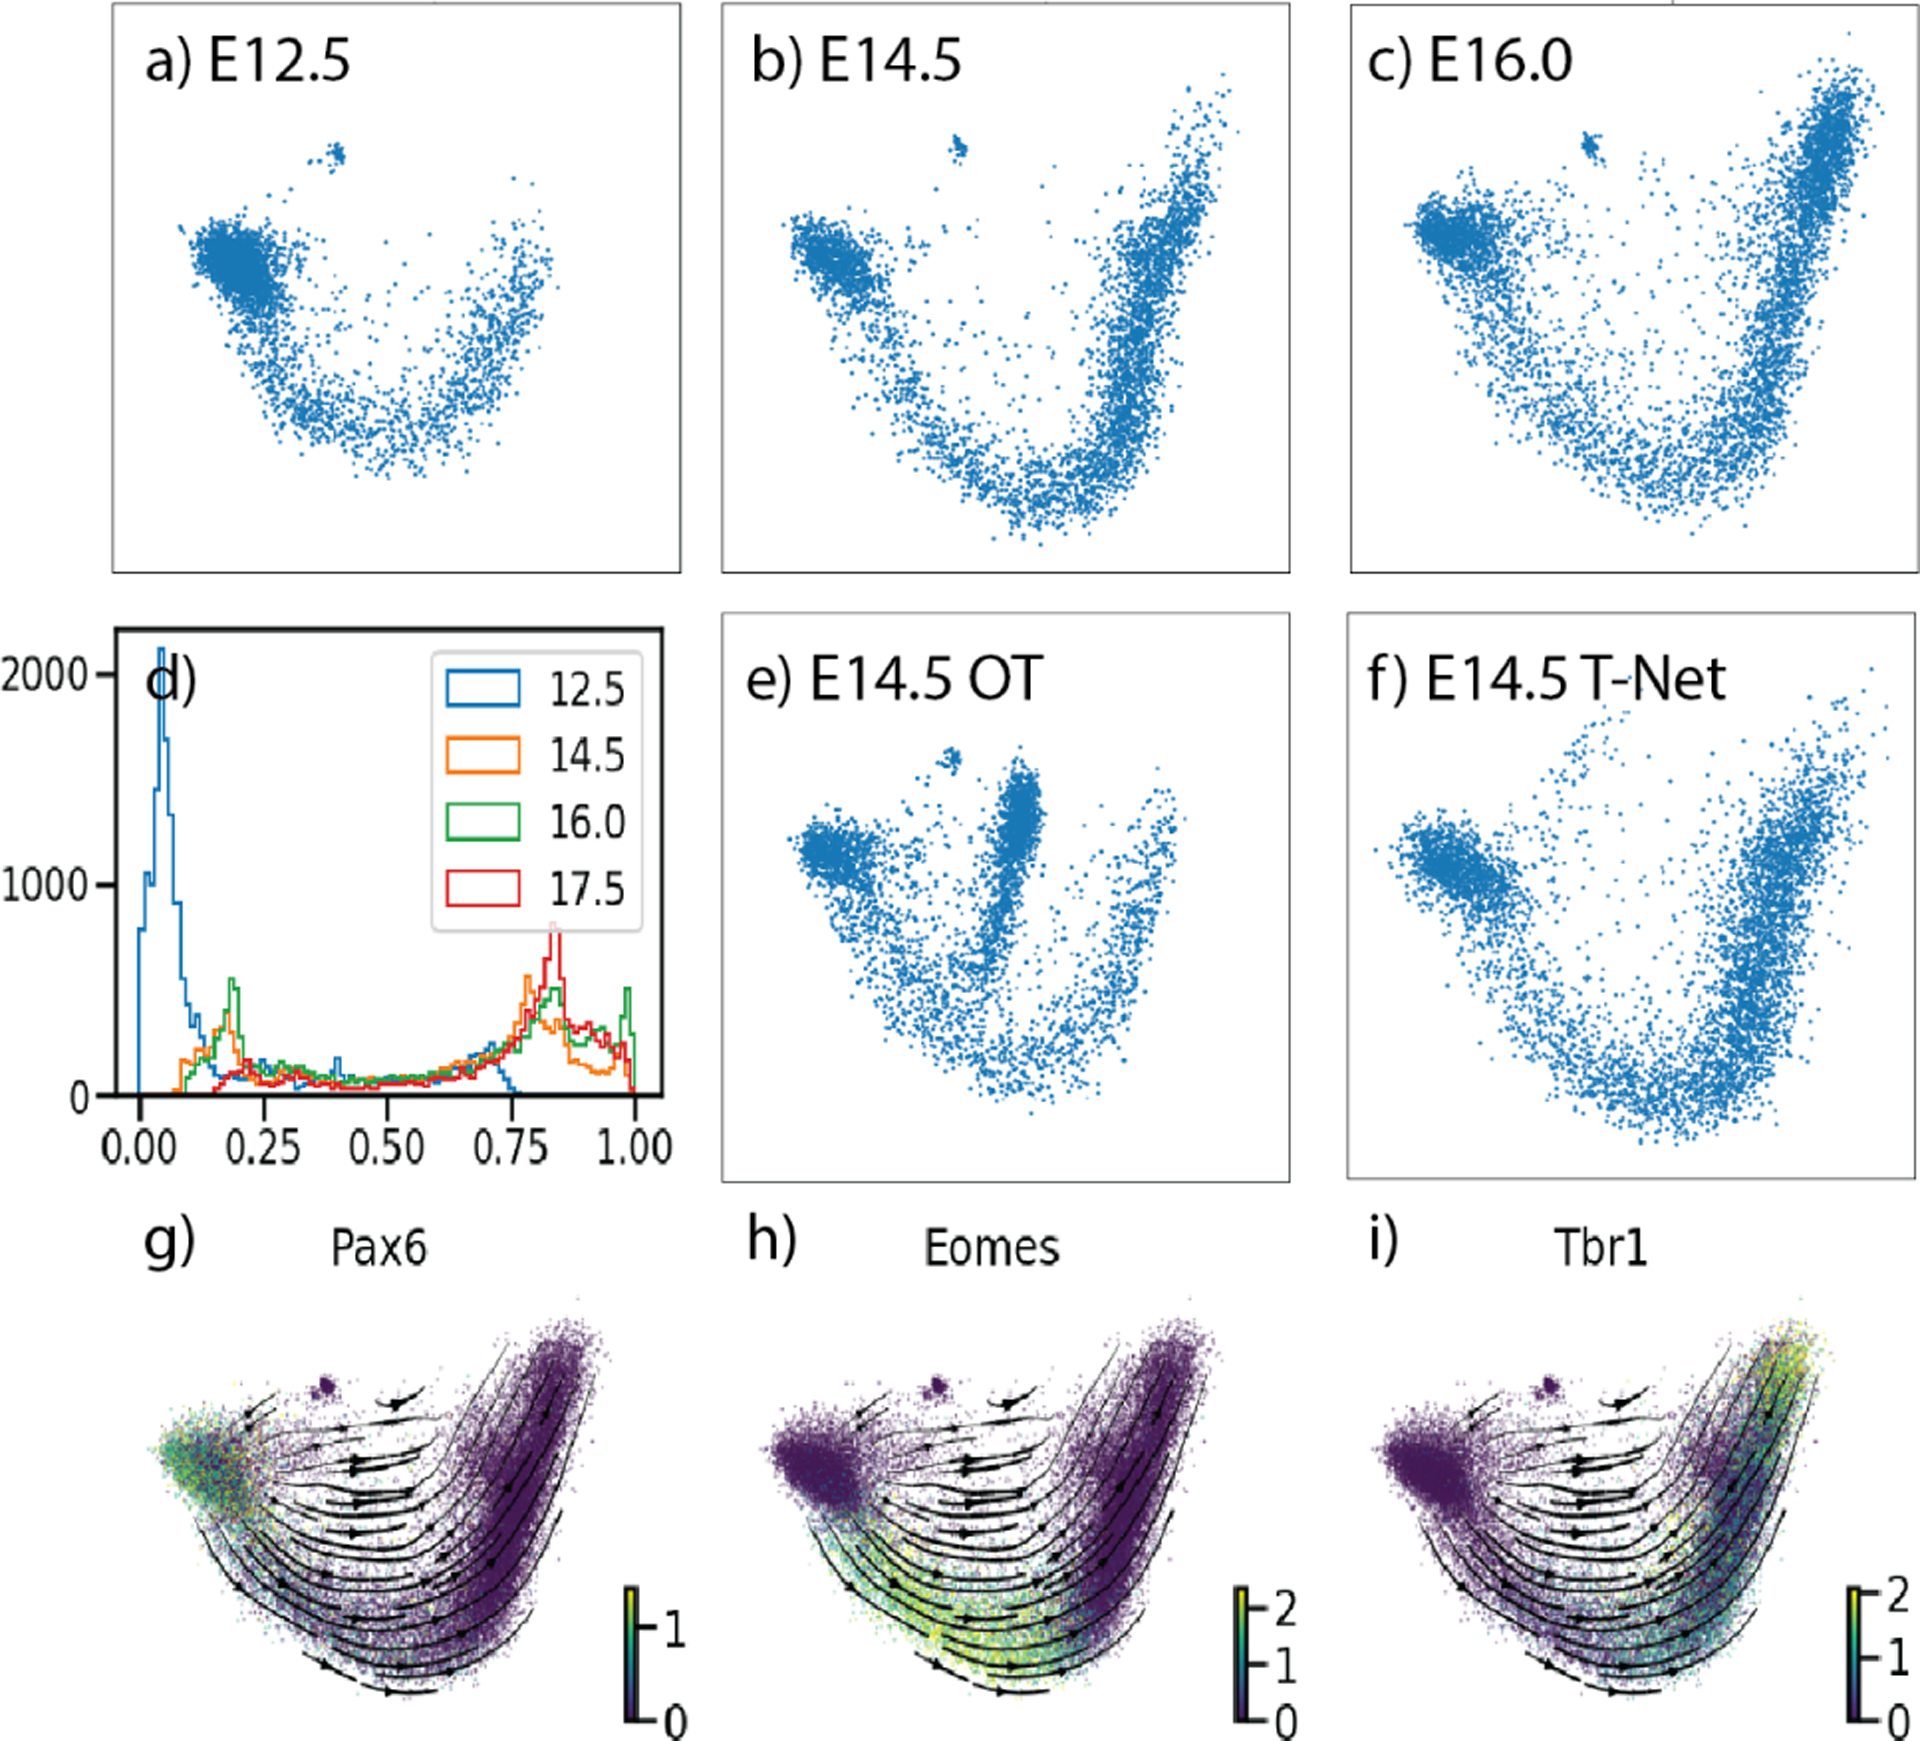
Figure 6.

Shows the first 2 PCs of the mouse cortex dataset. (a-c) show the distributions for the first three timepoints. (d) shows the distribution of cells over PC1. the interpolated points for E14.5 using (e) static OT, and (f) TrajectoryNet with density regularization. (g-i) shows expression of three markers of early (Pax6) mid (Eomes) and late (Tbr1) stage neurons.
