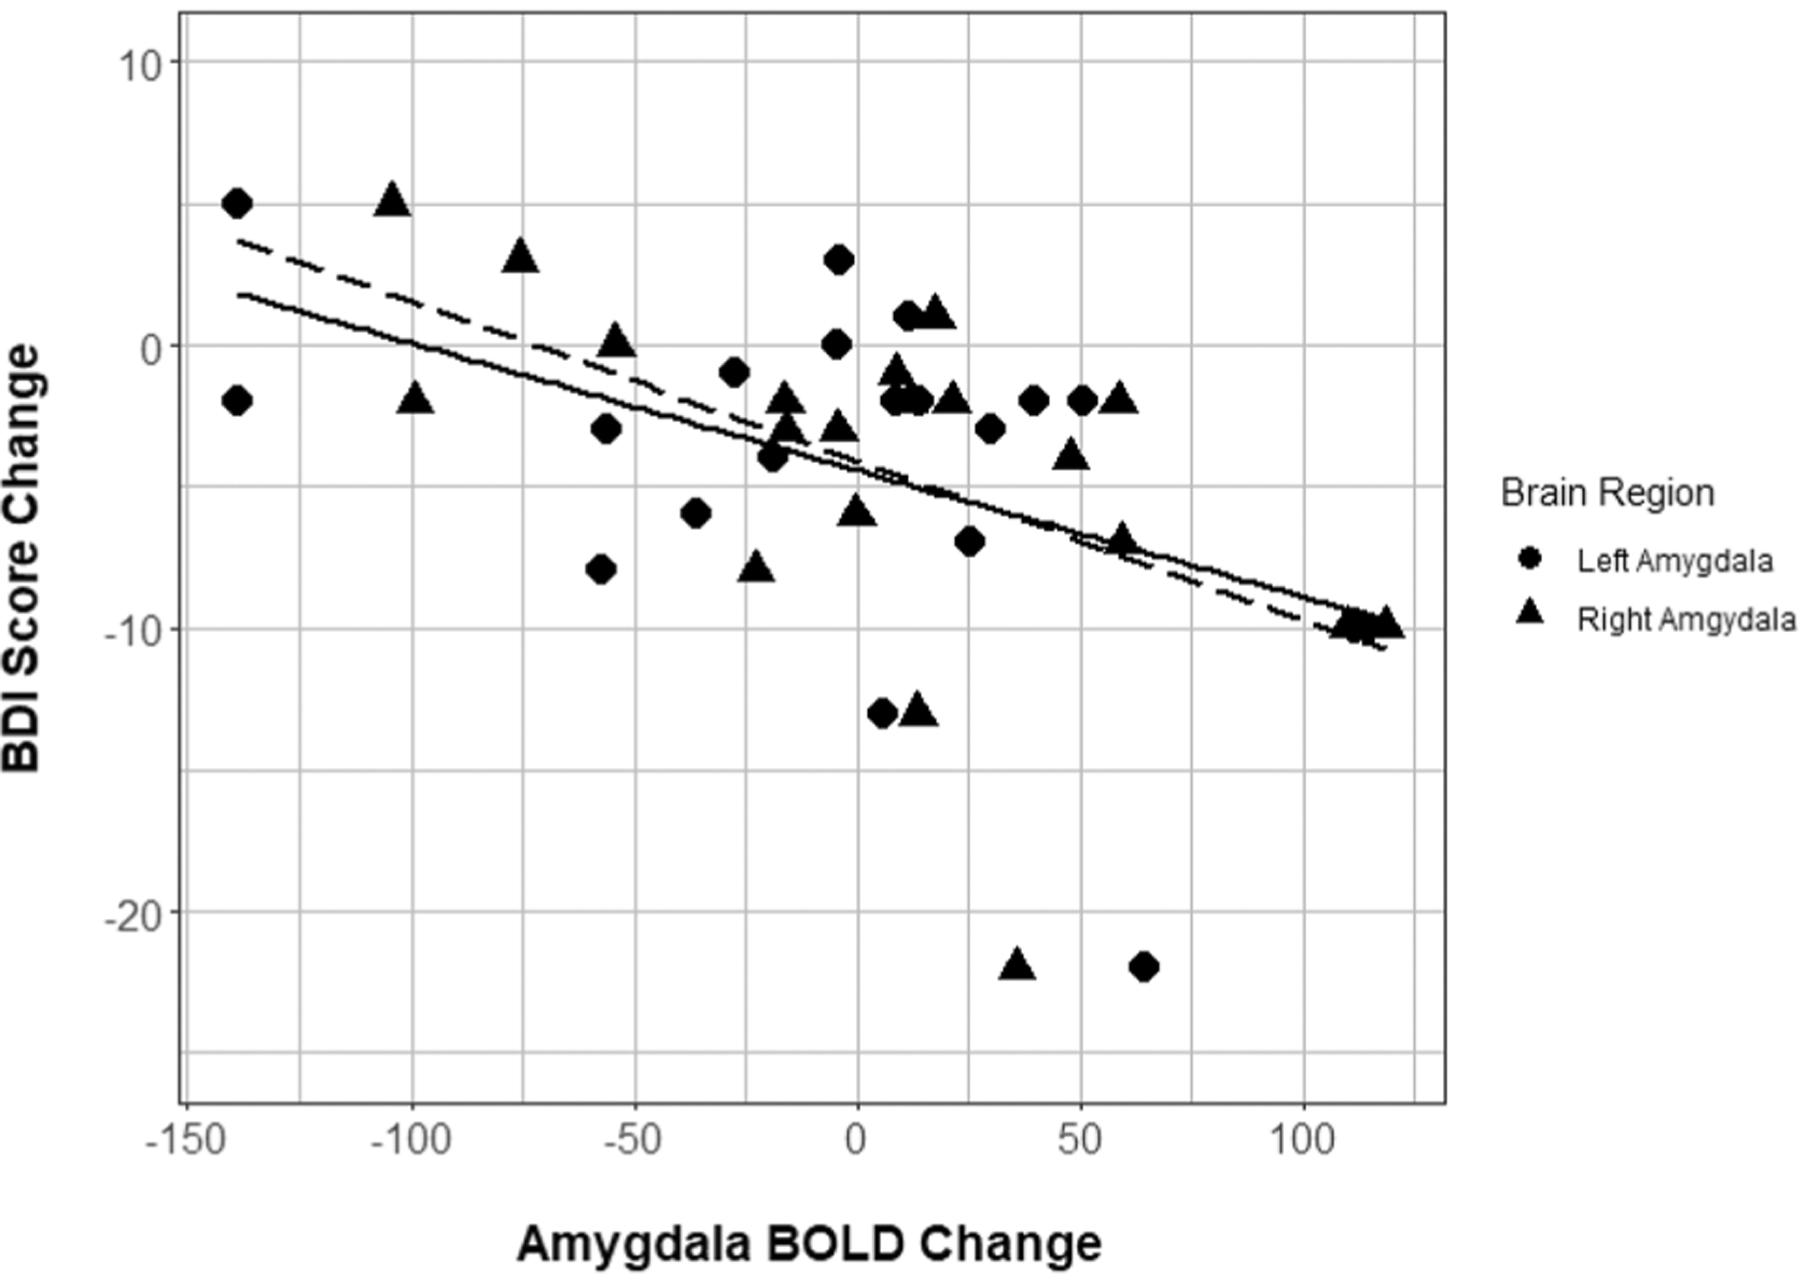
Fig. 2.

Amygdala BOLD response change by BDI score change. Scatterplot of bilateral amygdala BOLD response change over time (arbitrary units) with BDI score change over time. Lines of best fit included for descriptive purposes (right amygdala = dashed, left amygdala = solid). BDI Beck Depression Inventory II
