Figure 2.

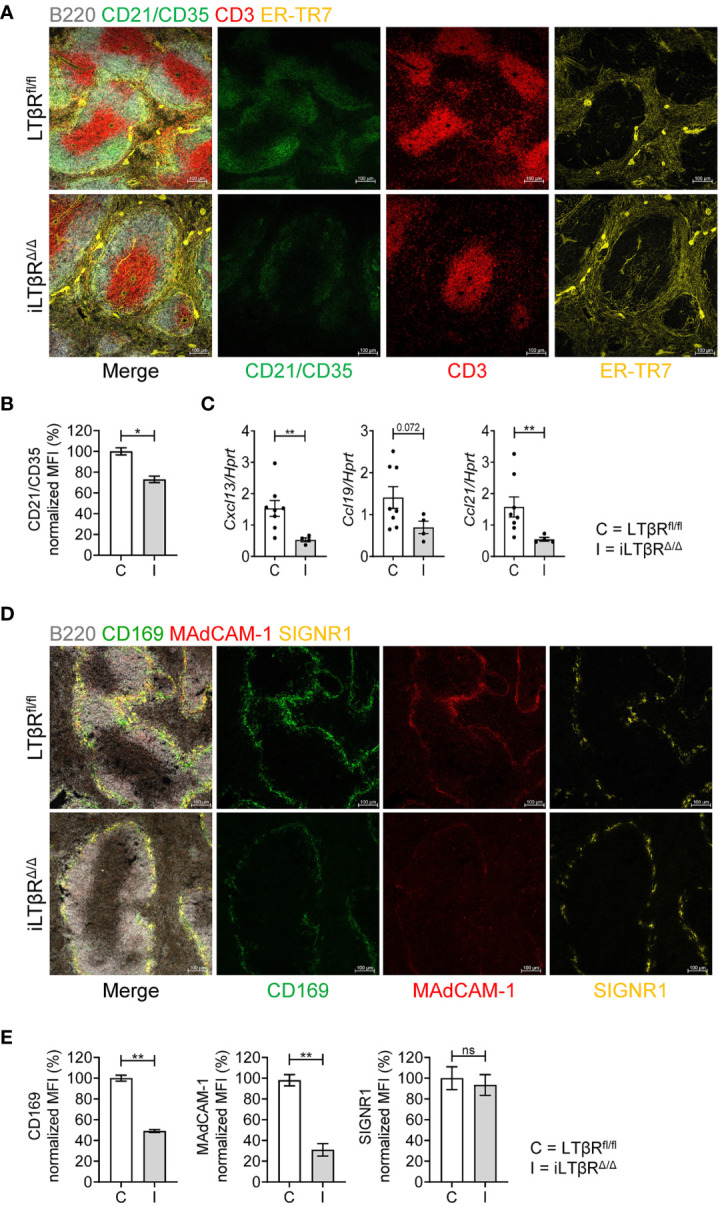
Impact of inducible LTβR inactivation in adulthood on spleen microarchitecture. LTβRfl/fl (C) and iLTβRΔ/Δ (I) mice were treated with TAM by oral gavage one month before analysis. (A) Representative confocal images of frozen spleen sections stained with antibodies against B220 (white), CD21/CD35 (green), CD3 (red) and ER-TR-7 (yellow). (B) Quantification of FDCs. n=4 per group. (C) Expression of splenic CXCL13, CCL19, and CCL21 mRNA determined by qPCR (n=4-8). (D) Representative confocal images of frozen spleen sections stained with antibodies against B220 (white), CD169 (green), MAdCAM-1 (red) and SIGNR1 (yellow) to analyze the marginal zone structure. (E) Quantification of CD169, MAdCAM-1 and SIGNR1 expressing cells. n=4 per group. Scale bars = 100μm for all images. Data shown are means ± SEM. Bars show the mean, symbols represent individual mice. Data is from one of two experiments with similar results. Significance was determined using Mann-Whitney or Unpaired t-test. Not significant (ns, p > 0.05), *p < 0.05, **p < 0.01.
