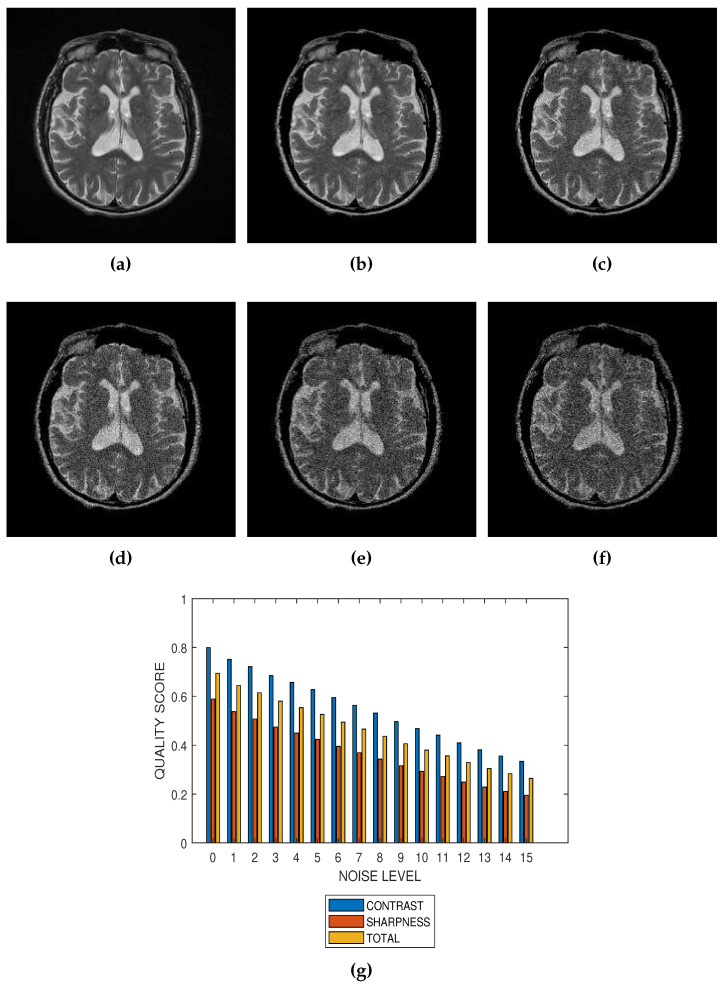
Figure 6.
(a) A T2 weighted MRI slice from ADNI and its degraded versions at Rician noise levels (b) 3 percent, (c) 6 percent, (d) 9 percent, (e) 12 percent and (f) 15 percent. (g) Variation of contrast, sharpness and total quality scores for Rician noise levels that vary from 0 percent to 15 percent.

