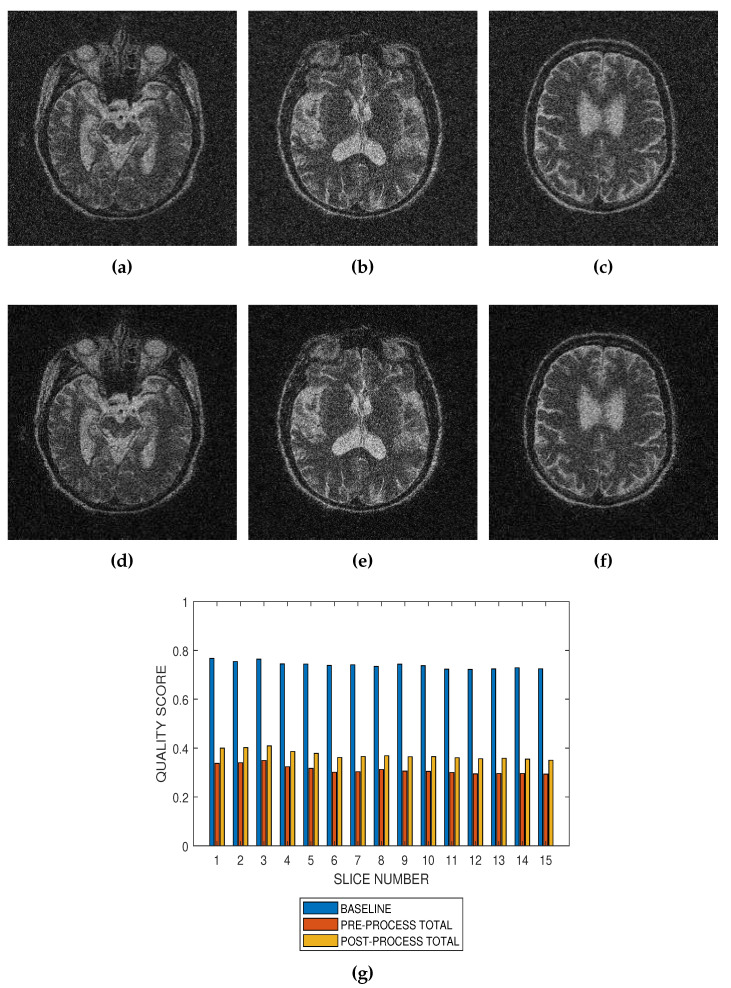
Figure 9.
Application of the proposed method to the assessment of an image enhancement algorithm. (a–c) are slices numbers 20, 27 and 34, respectively in a T2 MRI volume degraded with 12 percent Rician noise. (d–f) are the slices displayed in (a–c) but their quality have been enhanced using a bilateral filter. (g) The baseline quality score of the original image, the predicted total quality indices of 12 successive T2 MRI slices in a volume data before and after enhancement with a bilateral filter.

