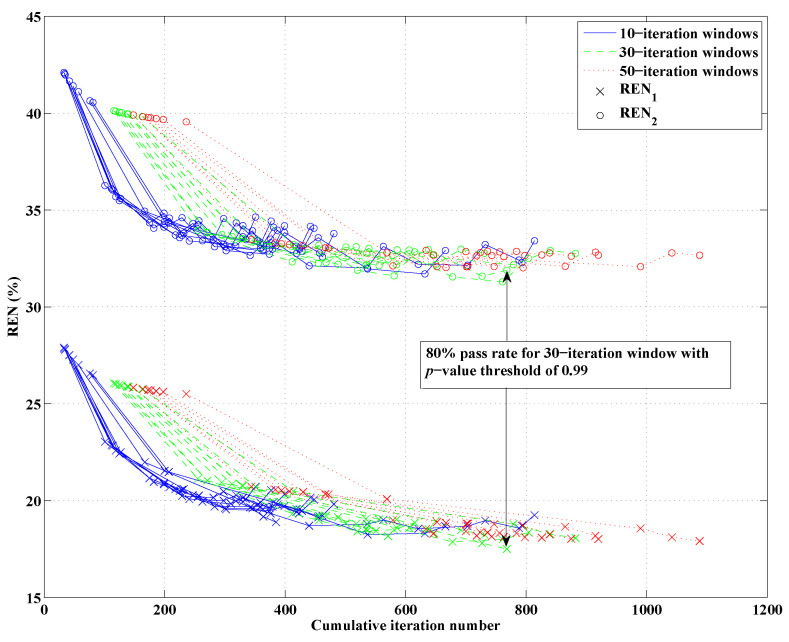
Figure 6.
Relative error norms of open-boundary 2D DGM-CSI reconstructions across several choices of stopping criteria parameter values. Each curve in the figure corresponds to a frequency-cycled inversion for a particular choice of the three parameters (Section 3.1), with the window sizes coded by color for convenience. Data points on each curve correspond to REN values for the reconstructed model at each frequency change. Arrows point to the final REN values of simulations that terminated with the lowest relative error norms, indicating the best combination of parameters among those tested for this imaging scenario.

