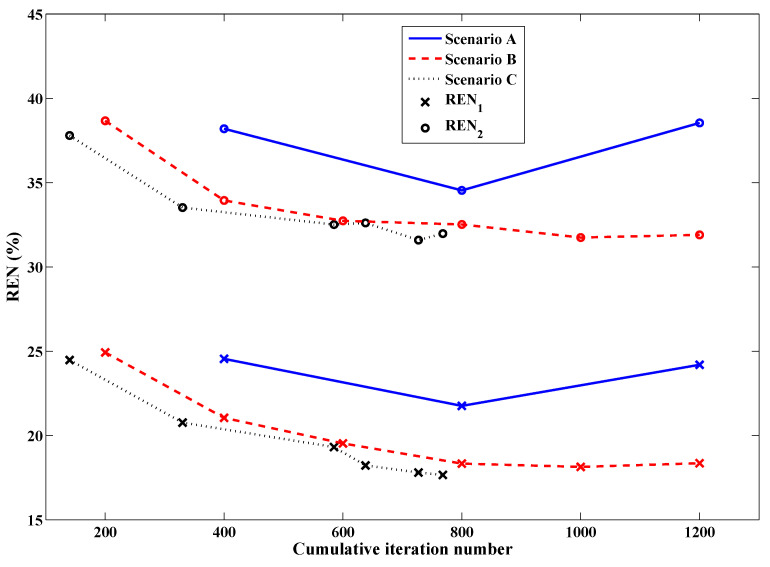
Figure 7.
Relative error norms of frequency-hopping and frequency-cycled reconstructions: Scenario A (solid line)—without tissue-dependent mapping at 400 iterations per frequency terminating after first inversion of 3.0 GHz, Scenario B (dashed line)—with tissue-dependent mapping at 200 iterations per frequency, cycling through reconstruction frequencies once (with imaginary component “anchored” following initial 1.0 GHz inversion), Scenario C (dotted line)—with tissue-dependent mapping and stopping criteria in place, terminating after two consecutive inversions of 1.0 GHz data (one with the imaginary component “anchored” and the final run with the imaginary component freely optimized according to the guidelines of Section 2.5). See Table 1 for further details.

