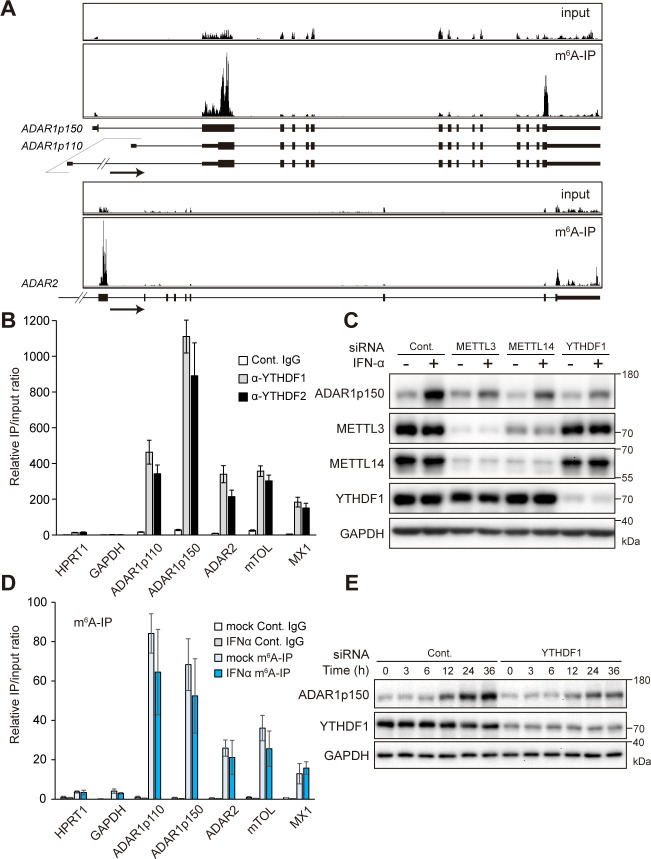
Fig 1. m6A methylation on ADAR mRNAs.
(A) m6A-seq data of the ADAR1 and ADAR2 transcripts in HepG2 cells showing m6A modification on both transcripts, modified from Dominissini and colleagues [9]. An arrow indicates the transcription direction. (B) RIP RT-qPCR showing binding of YTHDF1 and YTHDF2 to ADAR1p110 and ADAR1p150 mRNAs in A172 cells. The signals were normalized to input samples. HPRT1 and GAPDH were used as negative controls. mTOL and MX1 were used as positive controls. (C) Immunoblot analysis showing knockdown effects of METTL3, METTL14, and YTHDF1 on IFN-induced ADAR1p150 protein expression in A172 cells. (D) m6A-RIP RT-qPCR showing m6A modification on ADAR1p110 and ADAR1p150 mRNAs. HPRT1 and GAPDH were used as negative controls. mTOL and MX1 were used as positive controls. (E) Immunoblot analysis showing time course of ADAR1p150 protein expression after IFN-α stimulation. Immunoblot images are representative of 3 biological replicates. (B, D) n = 3 for all experiments. Data are presented as the mean ± SEM. The numerical values for this figure are available in S1 Data. ADAR, adenosine deaminase acting on RNA; IFN, interferon; IgG, immunoglobulin G; IP, immunoprecipitation; m6A, N6-methyladenosine; RIP, RNA immunoprecipitation; RT-qPCR, quantitative reverse transcription PCR; SEM, standard error of the mean; siRNA, small interfering RNA.

