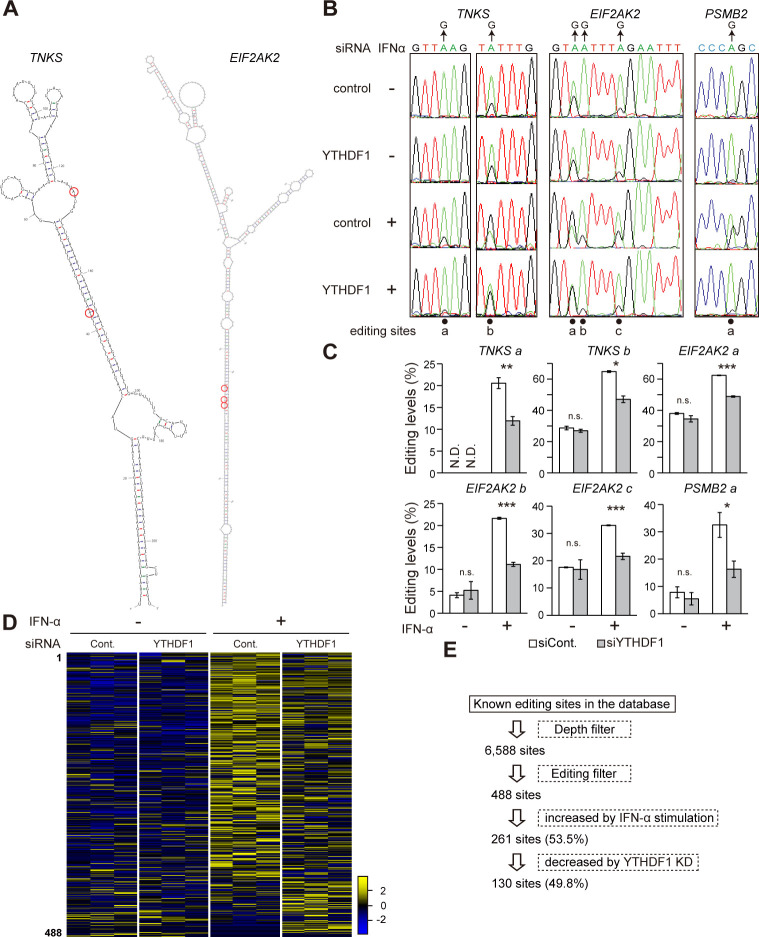
Fig 2. YTHDF1 knockdown reduces IFN-induced A-to-I RNA editing.
(A) Predicted secondary structure of TNKS and EIF2AK2 transcripts by the mfold web server. Red circles indicate A-to-I RNA editing sites. (B) Direct sequencing chromatogram showing from RT-PCR products of TNKS, EIF2AK2, and PSMB2 mRNA following IFN-α stimulation. (C) Effect of YTHDF1 knockdown on A-to-I RNA editing of a few selected transcripts following IFN-α stimulation. Reduced IFN-induced A-to-I RNA editing was observed with YTHDF1 knockdown. Two-tailed Student t tests were performed to assess the statistical significance of differences between groups, *p < 0.05, **p < 0.01, ***p < 0.001, n.s. p ≧ 0.05, N.D. means not detected. n = 3 for all experiments. Data are presented as the mean ± SEM. (D) A heatmap of over editing levels from 3 biological replicates at 488 selected editing sites. Editing level changes were shown in each row covering all editing sites, ranked by the editing level. High editing levels were displayed in yellow and low in blue. An overall IFN-induced A-to-I RNA editing levels were reduced with YTHDF1 knockdown. (E) A flowchart for identification of IFN-induced editing sites. The numerical values for this figure are available in S1 Data. A-to-I RNA editing, adenosine-to-inosine RNA editing; IFN, interferon; KD, knockdown; n.s., not significant; RT-PCR, reverse transcription PCR; SEM, standard error of the mean; siRNA, small interfering RNA.

