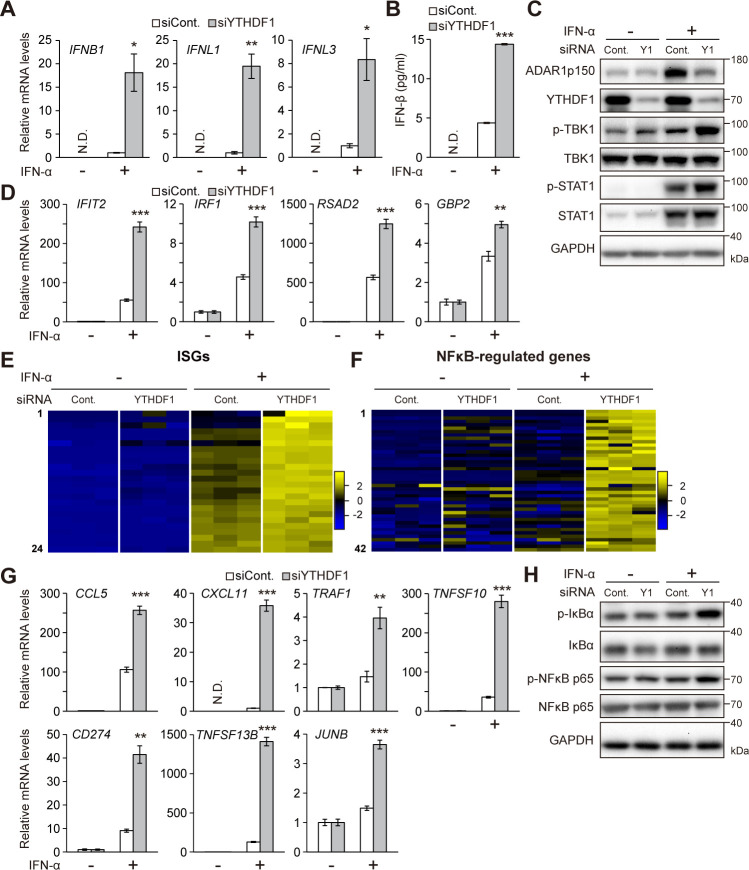
Fig 3. YTHDF1 knockdown induces IFN responses.
Cells were treated with mock (−) or IFN-α (+). (A) RT-qPCR showing significantly elevated expression of IFN genes upon YTHDF1 knockdown and IFN stimulation. The signals were normalized to control siRNA samples. (B) Spontaneous IFN-β secretion by cells transfected with control or YTHDF1-specifc siRNA as quantified by ELISA after stimulation of IFN-α. (C) Immunoblot analyses of TBK1 and STAT1 phosphorylation levels. Immunoblot images are representative of 3 biological replicates. (D) RT-qPCR showing significantly elevated expression of ISGs upon YTHDF1 knockdown and IFN stimulation. The signals were normalized to mock treatment samples. (E, F) Heatmaps of expression levels of ISGs (E) and NF-κB–inducible genes (F) from RNA-seq data. (G) RT-qPCR showing significantly elevated expression of NF-κB–inducible genes upon YTHDF1 knockdown and IFN stimulation. The signals were normalized to mock treatment samples except for CXCL11. (H) Immunoblot analyzing of IκBα and NF-κB p65 phosphorylation levels. Immunoblot images are representative of 3 biological replicates. (A, D, G) The signals were normalized to GAPDH. (A, B, D, G) Two-tailed Student t tests were performed to assess the statistical significance of differences between groups, *p < 0.05, **p < 0.01, ***p < 0.001, N.D. means not detected. n = 3 for all experiments. Data are presented as the mean ± SEM. The numerical values for this figure are available in S1 Data. IFN, interferon; ISG, IFN-stimulated gene; RT-qPCR, quantitative reverse transcription PCR; SEM, standard error of the mean; siRNA, small interfering RNA; TBK1, TANK-binding kinase 1.

