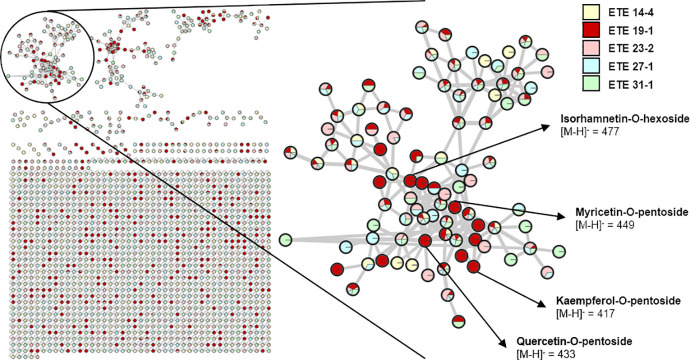
Fig 6. Molecular network of the 5 selected ethanolic extracts (SEs) of U. molinae fruits from different genotypes.
The molecular network was created using the online workflow (https://ccms-ucsd.github.io/GNPSDocumentation/) on the GNPS website (http://gnps.ucsd.edu) and then exported to Cytoscape. Each node represents a precursor ion and clusters of related molecules were formed by analyzing the similarities among their fragmentation patterns. The area of each color in the nodes represents the abundance of the precursor in each extract. One cluster containing flavonol glycoside derivatives is shown in detail and some of the compounds identified only in ETE 19–1 are presented.

