Table 3.
Qualitative description of some of the most important identified features.
| Features | Tumor Examples | Description | |
|---|---|---|---|
| (High Value) | (Low Value) | ||
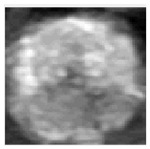
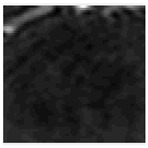
| Correlation |
|
|
Measures the linear relationship between two variables (pixels coordinates for images). In other words, measures the similarity between neighborhood sub-image’s regions. |
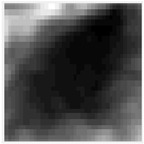
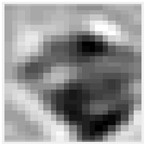
| Information Measure of Correlation |
|
|
Measures the amount of information that one variable contains about another. In other words, it measures how irregular is the texture of an image. |
| Sum Average |
|
|
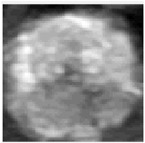
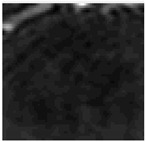
Provides the average of the grey values from ROI. |
