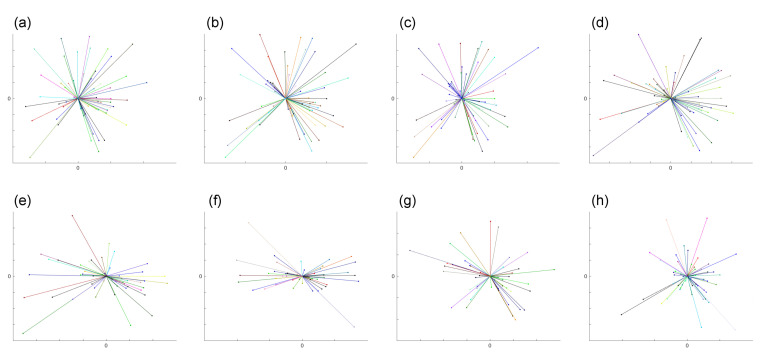
Figure 4.
The plots demonstrate graphically the random walk cell migration patterns from Dataset 1 obtained from (a–h) with time step intervals 30-s, 1-, 2-, 3-, 5-, 7.5-, 10-m and 15-min, respectively. The detailed numbers are shown in Table 1. We overlaid the starting point of each trajectory at the centre point and link the ending point, so as to illustrate the general direction of the cell.

