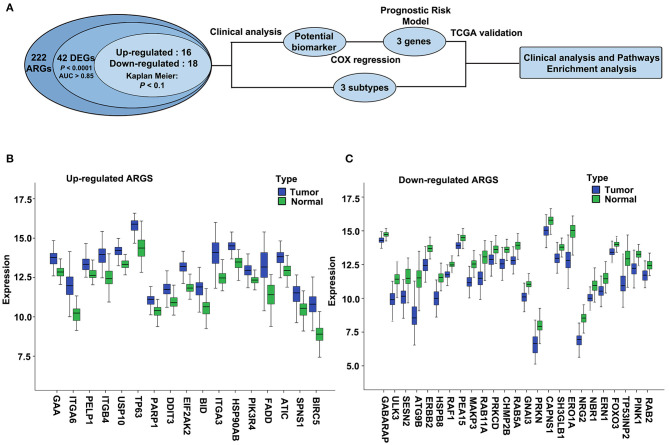
Figure 1.
The overall flowchart and significantly differentially expressed autophagy-related genes (ARGs) in esophageal squamous cell carcinoma (ESCC). (A) Procedure for the selection and validation of the prognostic risk model in ESCC. DEGs, differentially expressed genes. (B,C) The expression patterns of 42 ARGs in ESCC and paired normal samples. Blue box represents tumor, and green box represents normal. (B) Upregulated ARGs. (C) Downregulated ARGs.

