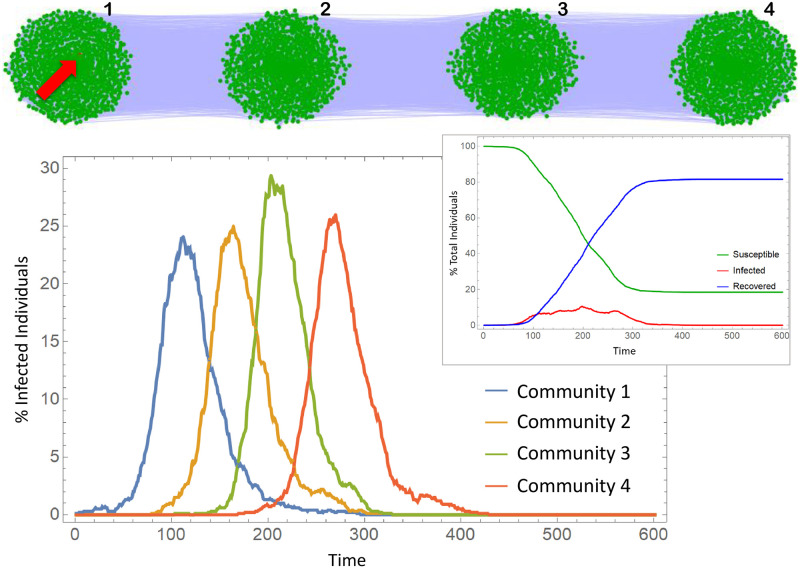
Fig 5. Contact network of four communities on a line and infection curves.
Communities are Barabasi-Albert networks with 1000 nodes. We have kept the average degree constant and equal to 100 in all simulations. The infection starts with a single infected individual in the first community (red node indicated with the red arrow). The epidemic parameters are in S1 Appendix.

