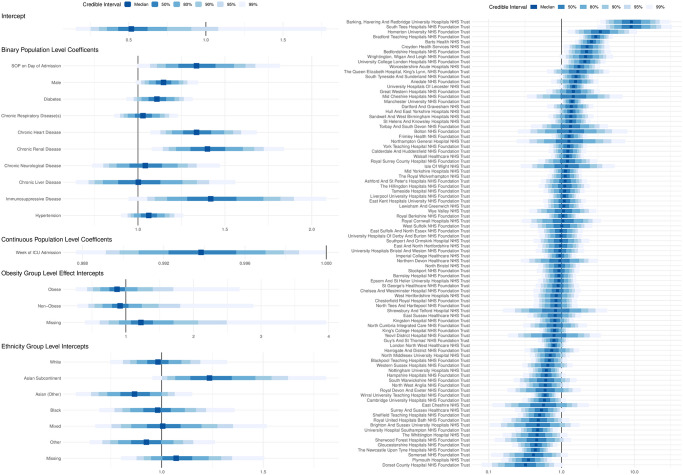
Fig 3. Forest plot of all co-variates in the final model where a binary flag indicating that a serious operational problem occurred on the date of admission.
(Left) A forest plot of all the effect estimates and marginal posterior densities for each covariate in the final model in which a serious operational problem occurred on the date of admission was captured using a binary flag (Yes/No). (Right) The marginal posterior densities (on a log odds scale) for the random effect for each trust (i.e. small group of hospitals that function as a single operational unit), in the aforementioned model.

