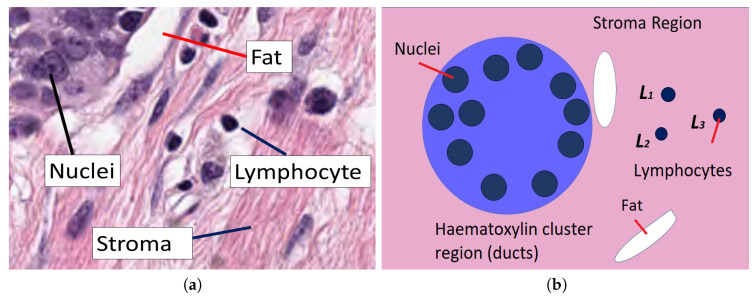
Figure 1.
(a) Stroma region which shows several clusters, regions of fat as well as some lymphocytes. (b) Graphical description of the elements that are analysed in this work. Within a stroma, the connective tissue shown in pink region, ducts appear as clusters stained with haematoxylin and contain several nuclei. Outside these ducts, regions of fat appear white and lymphocytes appear purple.

