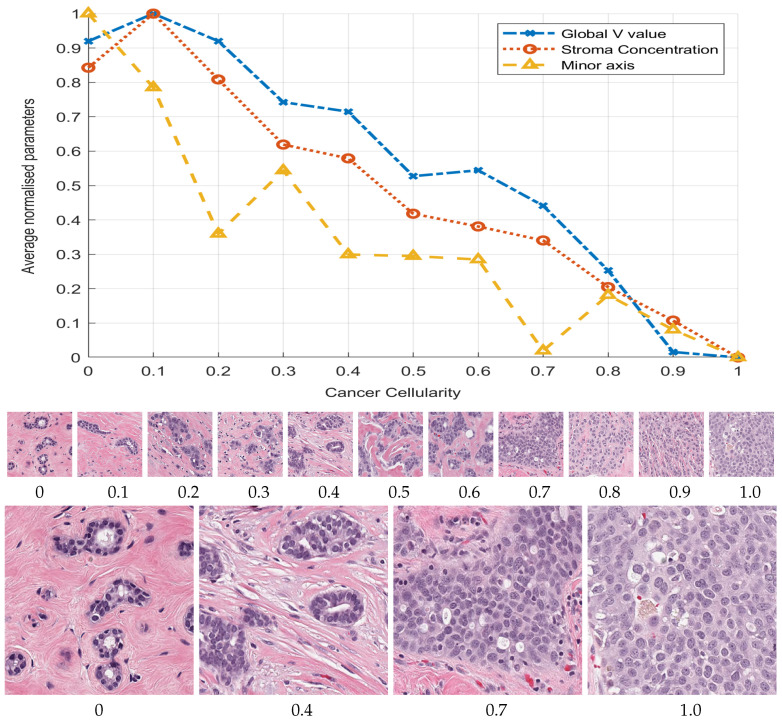
Figure 2.
Graphical display of three selected morphological parameters against the cellularity: Global stroma filtered region (o), minor axis (△) and Value concentration in region (x). Cellularity was manually ranked by a pathologist and the parameters automatically extracted. The plots represent average parameter value normalised with maximum value to be compared in the same graph. The graph indicates an inverse relationship between respective parameter and cellularity. Thumbnails show images with cellularity values from zero to one and magnified versions of cases with values 0, , , and 1, where the prevalence of cancerous cells can be clearly observed.

