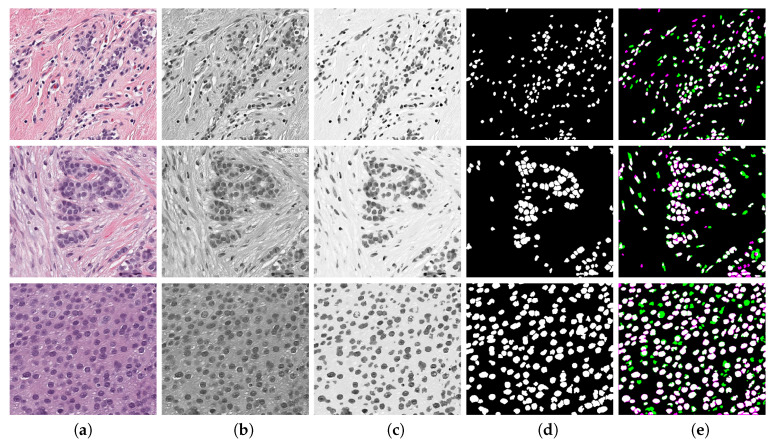
Figure 4.
Enhancement of nuclei area. First row corresponds to a Tumour Cellularity (TC) value of zero, second row is an example of TC and third row is TC . Images in column (a) are the original image, (b) gray level images, (c) enhanced images, notice that the nuclei region is darker whilst background becomes lighter, (d) Binary image obtained with an adaptive threshold value estimated directly from strongest correlated parameter, and (e) validation of nuclei segmentation by Jaccard index. Reference image was manually segmented by using QuPath Platform.

