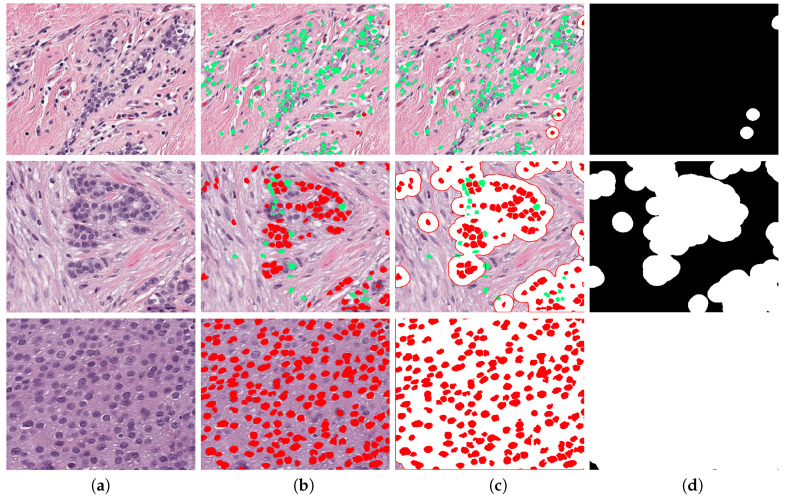
Figure 9.
Visual description of the method. Three TC cases are presented in each row: 0, and 1. (a) The original image, the image is segmented and key parameters are computed, then a classification predictor estimates either malignant or benign cells, shown in red and green, respectively in (b). A dilation of segmented malignant nuclei estimates full cytoplasm of every detected malignant cell (c) and TB region is shown in white in (d). The cellularity metrics calculated by the proposed methodology are: , and .

