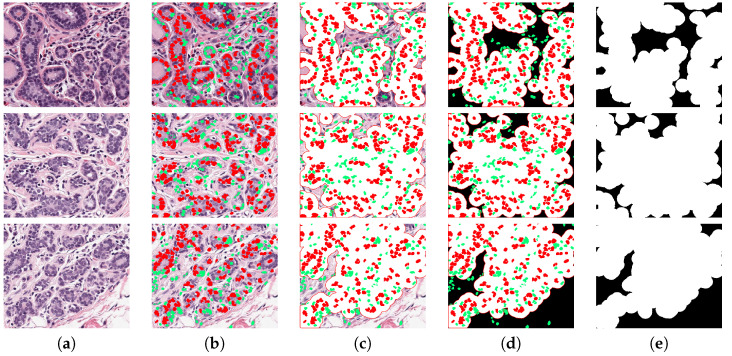
Figure 11.
Three cases where the TC was incorrectly calculated. Each row corresponds to a patch with incorrect TC. Column (a) illustrates the original image, and columns (b–e) show the step by step process to assess cellularity. (b) Corresponds to the segmented image and classified into benign (green) and malignant (red). Columns (c,d) show expanded region of malignant cells. Column (e) corresponds to cancer cell region in white, used to compute TC. Three worst cases correspond to a TC of zero; this means there would not be any malignant cell and TC image must be completely black. Several cells were miss classified which yields to a TC wrong assessment. Estimated TC values are: 0.75, 0.81, and 0.75, instead of zero.

