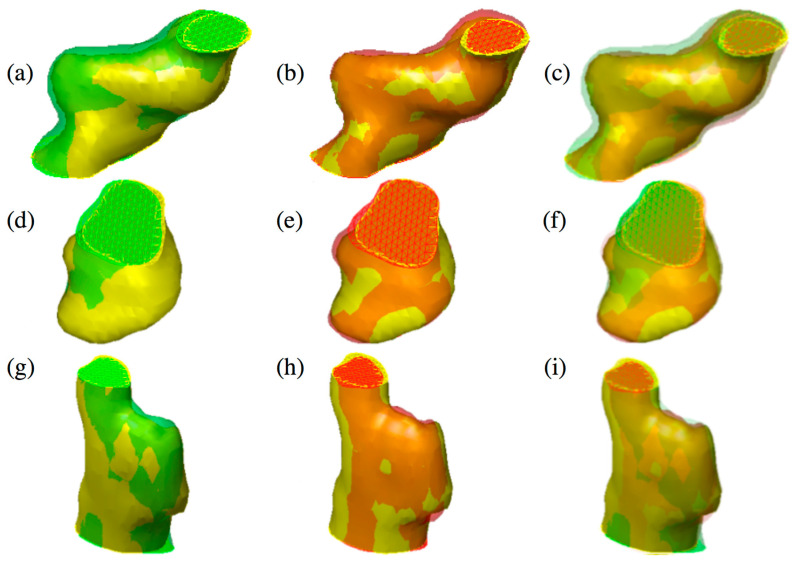
Figure 3.
Three different tumors reported in the figure show the difference between 2D active contours (a,d,g) [24] and 3D active surface (b,e,h) segmentations guided by the 3D classifier. The reconstructed surfaces (green and red) and the gold standards (in yellow) are rendered partially transparent for better comparison. In the last column, the overlap of both methods and the gold standard is shown (c,f,i). Specifically, an over-segmentation of the 2D approach compared to 3D can be observed. (Color images can be found on the electronic version of this article).

