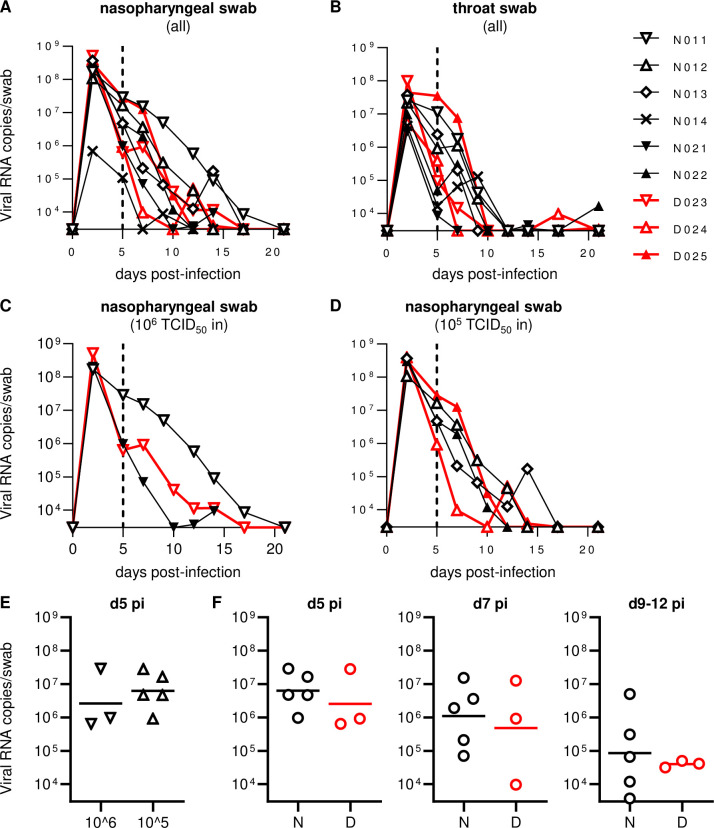
Fig 1. Viral RNA levels in swabs.
(A-D) Changes in viral RNA levels in nasopharyngeal (A, C, D) and throat (B) swabs after SARS-CoV-2 infection in all animals (A, B) or those infected with 106 (C) or 105 (D) TCID50 of SARS-CoV-2. The lower limit of detection was approximately 3 x 10³ copies/swab. (E) Comparison of viral RNA levels in nasopharyngeal swabs at day 5 post-infection between 106 TCID50-infected and 105 TCID50-infected macaques. No significant difference was observed. (F) Comparison of viral RNA levels in nasopharyngeal swabs at days 5 (left), 7 (middle), and 9–12 (right) post-infection between Group N and D animals infected with 106 or 105 TCID50 of SARS-CoV-2. No significant difference was observed.

