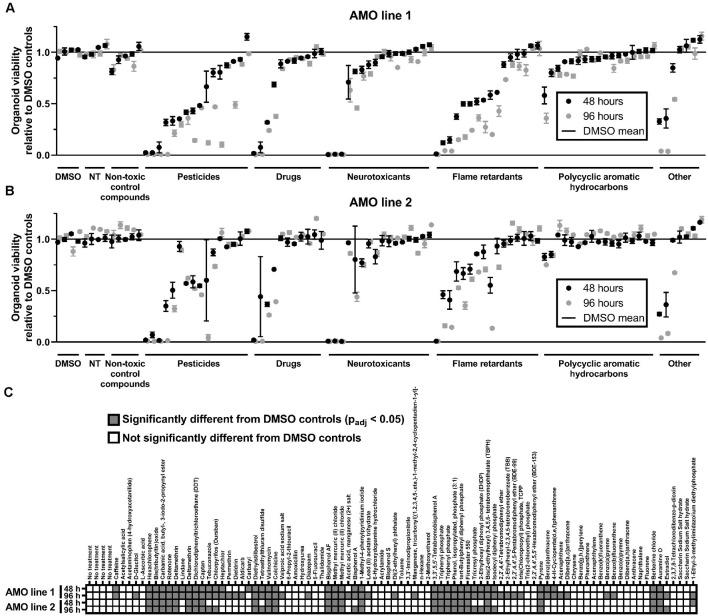
Figure 2.
General cell viability identified toxic compounds in an organoid-based high throughput screen. (A,B) While toxicant exposure yields a broad range of organoid viabilities, non-treated (NT) and non-toxic controls cluster around 100% of viability relative to DMSO controls. Dot plots depict the mean viability (relative to the DMSO controls) of organoids in the primary screen after 48 (black dots) and 96 h (gray dots) of compound exposure. Compounds are organized by categories listed below the x-axis, then by the viability of AMO line 1 at 48 h within each category. The order of compounds was maintained for subfigures (A) (AMOs from cell line 1), (B) (AMOs from cell line 2), and (C) (statistical analysis) to facilitate comparison. (C) Combined heatmap for both AMO lines and time points highlights compounds that significantly changed the AMOs’ viability compared to the DMSO controls. Statistical significance was determined via multiple unpaired t-tests, and, after correction for multiple testing, we considered padj < 0.05 as significant (see “Materials and Methods” section for details on statistical analysis). n = 3 organoids per condition, except nAMO line 2 48 h = 2 and nAMO line 1 48 h chrysene = 2. Plotted is the mean ± SEM. For exact number values see Supplementary Figure 1.

