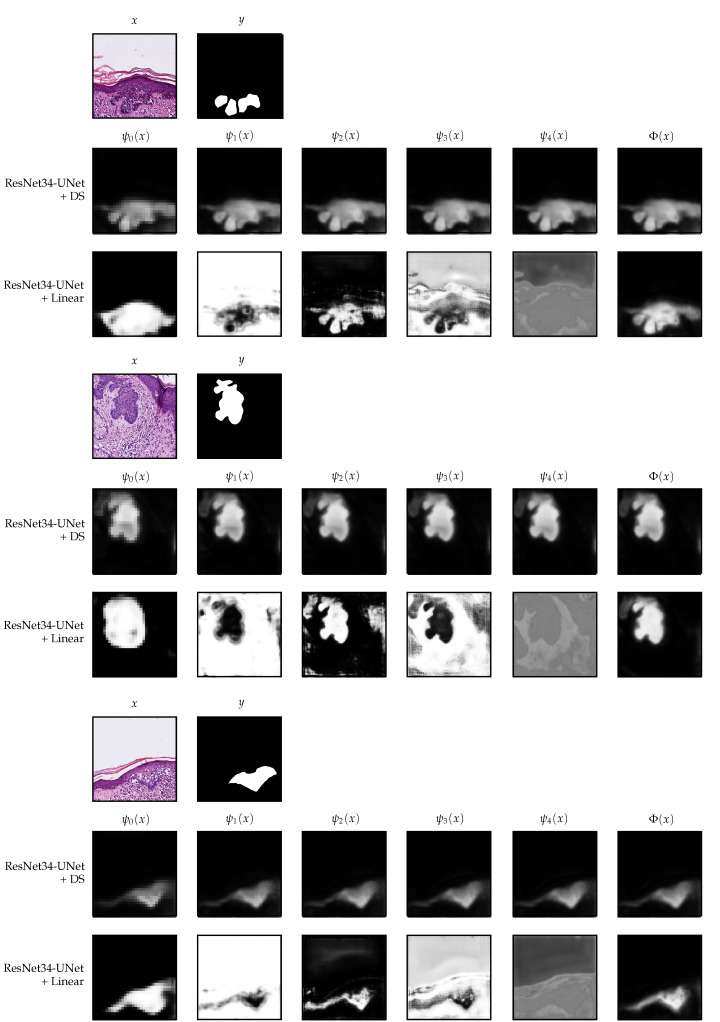
Figure 8.
Decoder outputs for each block of the decoder in the deep supervision and linear merge settings. The patches belong to the Validation I part of the data. For the linear merge strategy, the segmentation maps shown in the figure are after applying the Softmax operation, which we do in this case only for visualization purposes. All patches have pixels and are extracted at 10× magnification.

