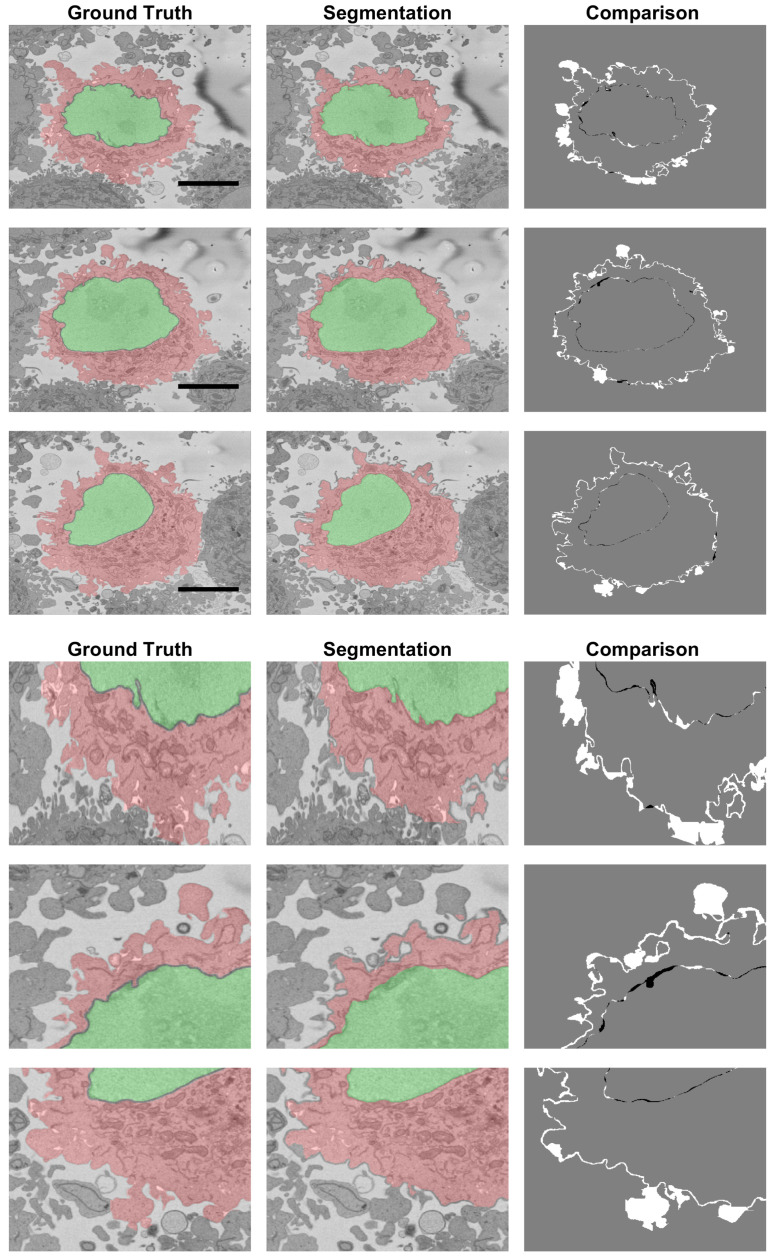
Figure 11.
Comparison between the Ground Truth (GT) and the segmentation result obtained from the segmentation algorithm shown in three slices of the stack. The left column illustrates the GT with shades of green for the nucleus and shades of red for the cell. The centre column shows the result of the segmentation algorithm. The right column shows the comparison between the GT and the results with FNs in white, FPs in black and both TPs and TNs in grey. Large white regions correspond to the distinction between neighbouring cells. A 5 μm scale bar is shown in the GTs on the top, and a magnification is shown below.

