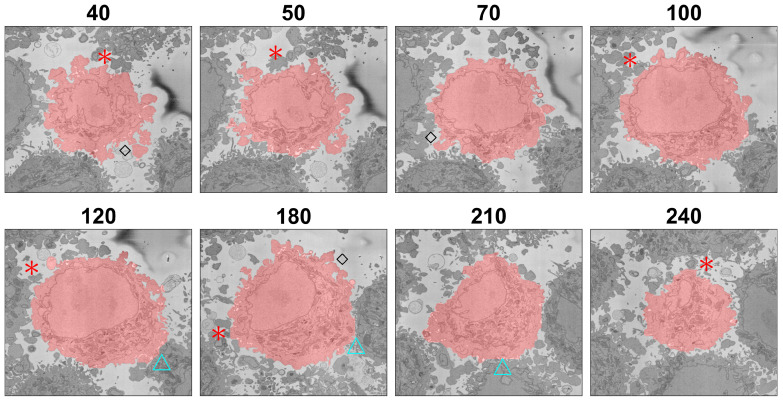
Figure 12.
Illustration of the segmentation at several slices of one cell. The segmentation is indicated with a red shade over the cell. Red asterisks indicate regions where the segmentation did not include protuberances that could belong either to the cell or to neighbouring cells. Blue triangles indicate regions where two cells were close together and the segmentation tended to a straight line between the cells. Black diamonds indicate convoluted protuberances that were correctly segmented. The slice number relative to the stack of 300 is indicated above each slice.

