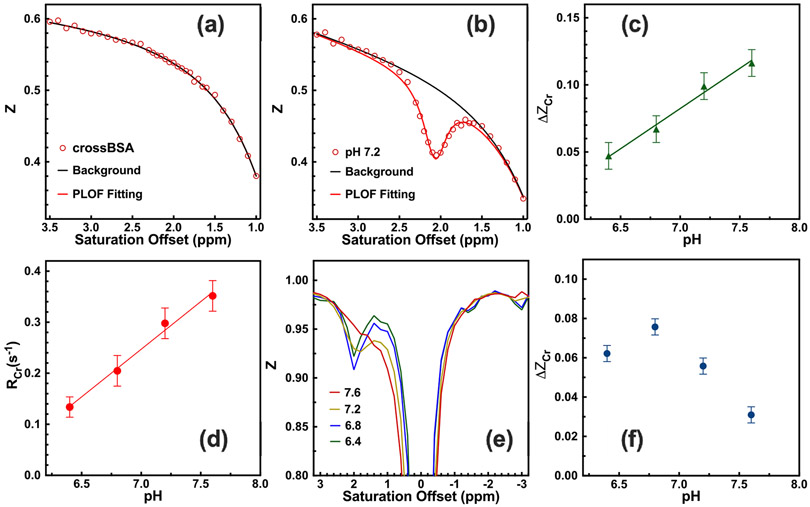
Fig 1.
Typical phantom CrCEST Z-spectra of (a) 15% CrossBSA only and (b) 50mM Cr with 15% CrossBSA (pH 7.2), acquired using a B1 of 2 μT and a saturation length of 1 s. Solid lines are the fitted background and the CEST peaks with the PLOF method. Identical PLOF fitting parameters were used for the fitting range and peak range in (a) and (b). In the fitting, the measured water T1 of 2.8 s−1 was used. (c) pH dependence of the Cr CEST signal. The solid line stands for the linear fit (R2 = 0.99). (d) pH-dependence of the RCr signal. The solid line stands for the linear fit (R2 = 0.99). (e) Typical phantom CrCEST Z-spectra of 10 mM Cr solutions with pH = 7.6, 7.2, 6.8 and 6.4. (f) The CrCEST signal as a function of pH value for the Cr solutions. The CrCEST was extracted by subtracting the Z-values at ±2 ppm.

