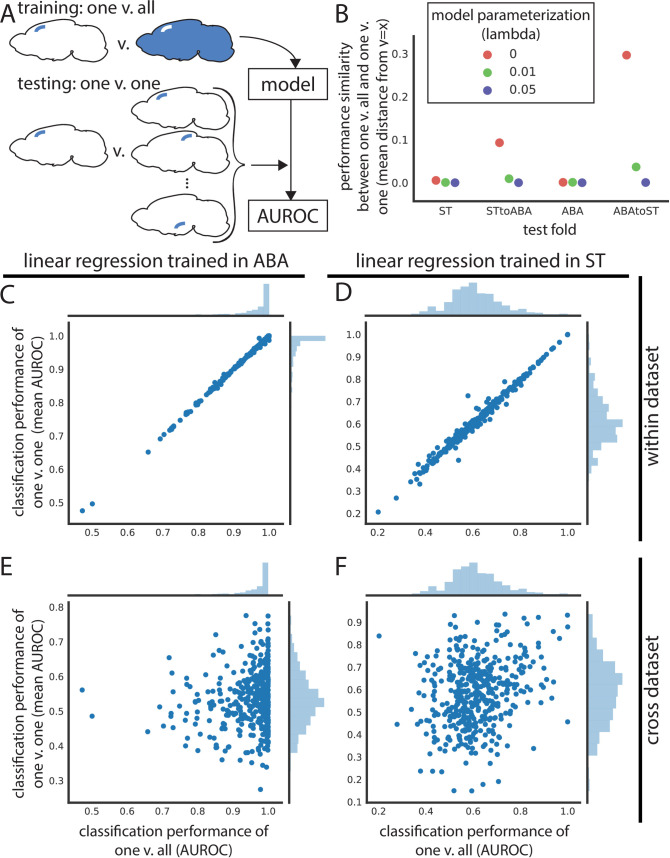
Fig 5. Leaf brain area expression profiles are identifiable within dataset but do not generalize cross-dataset.
(A) Schematic depicting training and testing schema for panels in this figure. Models are trained to classify one leaf brain area against the rest of the brain (one vs. all) and then used to test classification of that brain area against all other leaf brain areas (one vs. one) within and across dataset. (B) Performance similarity between one vs. all and one vs. one reported as the mean absolute value of distance from identity line for scatter plots of testing in one vs. all against one vs. one. Performance similarity shown for within ST, ST to ABA, within ABA, and ABA to ST across linear regression (red), LASSO (lambda = 0.01) (green), and LASSO (lambda = 0.05) (violet). Linear regression one vs. all test set performance (x-axis) vs. average one vs. one performance of the same model (y-axis) in (C) ABA and (D) ST. (E) Assessment of the same ABA one vs. all linear regression model (x-axis) in one vs. one classification in the ST dataset (y-axis). (F) Same as (E), but one vs. all linear regression trained in ST (x-axis) and one vs. one classification of these models in ABA (y-axis). ABA, Allen Brain Atlas; AUROC, area under the receiver operating curve; LASSO, least absolute shrinkage and selection operator; ST, spatial transcriptomics.

