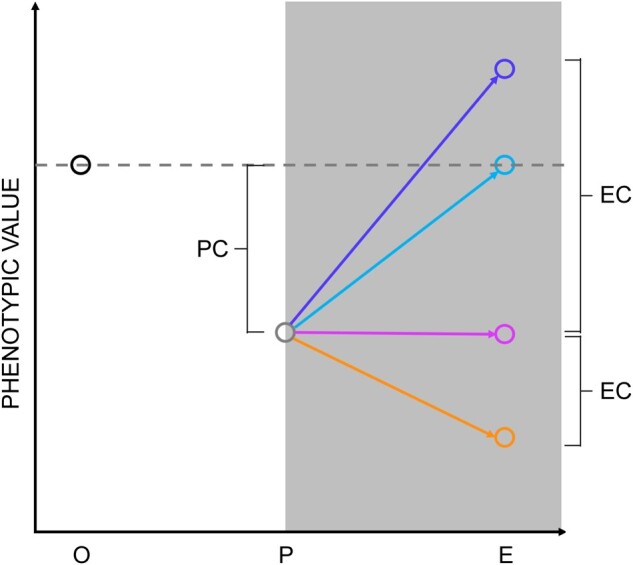
Fig. 1.

Correlation between plasticity and evolutionary outcomes. X axis labels: O represents the phenotypic value of the ancestor on the stiff substrate; P represents the plastic phenotypic value of the ancestor on the soft substrate; and E represents the phenotypic value after evolution on the soft substrate. PC, plastic change; EC, evolutionary change (see Results). The solid arrows represent potential trajectories of evolution; the dashed arrows represent the direction and magnitude of the constraint imposed by the ancestral fitness tradeoff.
