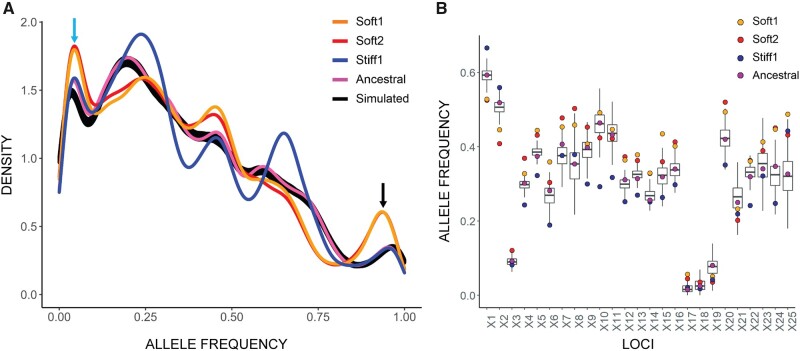
Fig. 3.
Density plot of alternative allele frequencies in the ancestral population and selected lines. (A) Two sets of three randomly chosen soft-selected lines were pooled to form two groups (Soft1 and Soft2). Three stiff-selected lines were also pooled (Stiff1). Exome sequencing of the pooled lines and ancestral population was performed at approximately 1000× average coverage, and allele frequencies calculated. The x axis shows the unfolded allele frequency spectrum of variant alleles relative to the reference allele. The greater density of rare variants is presumably because the inbred mouse from which the cell line was derived was homozygous for the reference allele at most loci. The two pooled sets of soft-selected lines exhibit an excess of alleles that are close to fixation or extinction (black and blue arrows). Black line, allele frequencies calculated from 500 simulated trajectories in the absence of natural selection (see text). (B) Change in allele frequency by locus, shown for the first 25 polymorphic loci on Chromosome 1. The boxplots represent the variation among 500 neutral simulations (see Materials and Methods for details of the simulations).

