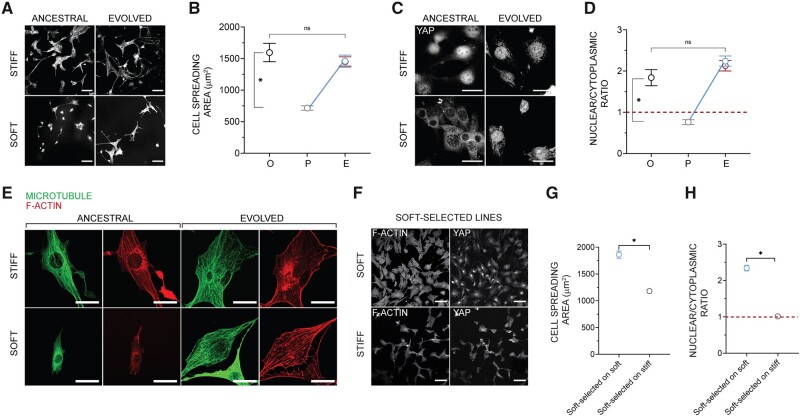
Fig. 4.
Phenotypic evolution. (A) Representative images of F-actin in ancestral populations cultured on the soft or stiff substrate for 3 days, and of evolved lines after 90 days of culture on the soft or stiff substrate; scale bar: 100 μm. (B) Mean spreading area of the ancestral cells on stiff substrate (O), ancestral cells on soft substrate (P), and selected lines after sustained culture (A) on soft (blue) or stiff substrates (red) (A); compare with the scheme in figure 1. Error bars, SEM; each data point represents the mean value from over 50 cells from three lines (randomly chosen); Kruskal–Wallis test with Dunn’s multiple comparisons test, *P < 0.05; ns, P > 0.05. (C) Representative images of YAP in ancestral populations cultured on the soft or stiff substrate for 3 days, and in selected lines after 90 days of culture on the soft or stiff substrate; scale bar: 30 μm. (D) Mean nuclear to cytoplasmic YAP intensity ratio in ancestral cells on stiff substrate (O), ancestral cells on soft substrate (P), and selected lines after sustained culture (A) on soft (blue) or stiff substrate (red) (A); compare with the scheme in figure 1. Error bars, SEM; each data point represents the mean value from over 50 cells from three lines; Kruskal–Wallis test with Dunn’s multiple comparisons test, *P < 0.05; ns, P > 0.05. (E) F-actin and microtubule structures in ancestral cells and selected lines after sustained culture on soft and stiff gels. Scale bar: 30 μm. (C and E). (F) Representative images of F-actin and YAP in soft-selected lines cultured on the soft or stiff substrate for 3 days. Scale bar: 100 µm (G) The mean spreading area of soft-selected lines on soft and stiff substrates. Error bars, SEM; each data point represents the mean value from over 225 cells from five or more lines (randomly chosen); Statistical significance was determined by Mann–Whitney U test; *P < 0.05. (H) The mean nuclear to cytoplasmic YAP intensity ratio of soft-selected lines on soft and stiff substrates. Error bars, SEM; each data point represents the mean value from over 200 cells from five or more lines (randomly chosen); Statistical significance was determined by Mann–Whitney U test; *P < 0.05.

