Fig. 5.
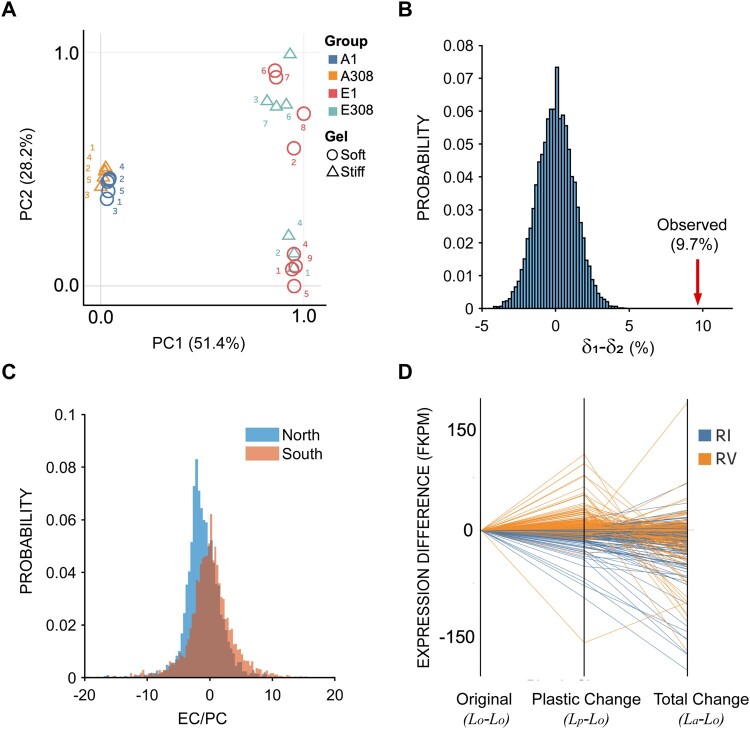
Analysis of gene expression. (A) Principal component analysis (PCA) of gene expression profiles. A1 and A308 represent ancestral cells cultured for 3 days on the soft (1 kPa) and stiff (308 kPa) substrates respectively. E1 and E308 represent cells evolved for 90 on the soft substrate (1 kPa) followed by 3-day culture on the soft (1 kPa) and stiff substrate (308 kPa) respectively. (B) Null δ1–δ2 distribution generated by randomly sampling eight replicates from the EC and PC distributions (see text for definition of EC and PC). The actual value for δ1–δ2 is indicated by a red arrow (see text). (C) Probability distributions of over all genes that exhibited statistically significant plasticity in the North (top cluster along PC2 in [A]) and South (bottom cluster along PC2 in [A]) clusters computed from parametric bootstrap simulations. (D) Parallel coordinate graphs depicting reversion or reinforcement of 449 genes identified as significantly reverted or reinforced from the parametric bootstrap simulation. Orange lines depict reversion (RV), blue lines depict reinforcement (RI); the indicated quantities at the bottom of the x axis are plotted for each individual, identified gene.

