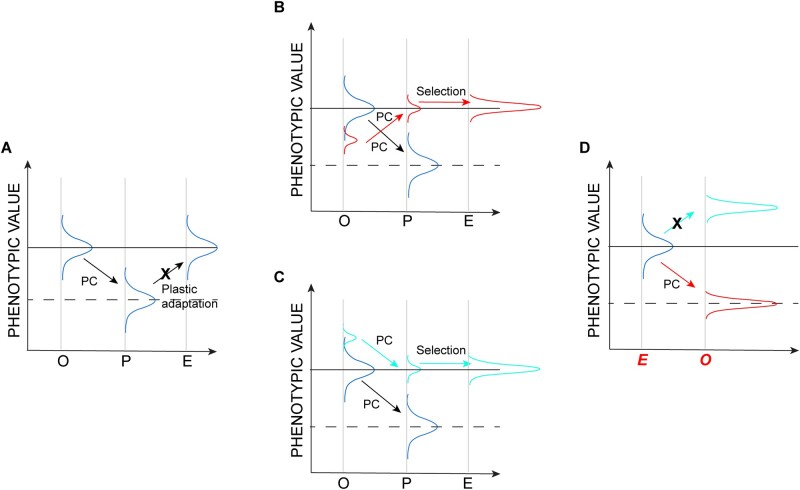
Fig. 6.
Plasticity and evolution revisited. Schematics show possible changes in hypothetical phenotypic distributions; labels on the X axis in panels (A–C) are as in figure 1. Arrows represent the direction of plastic change (PC). (A) The phenotypic response is the result of a change in phenotypic plasticity (“plastic adaptation”) over the long term. This scenario is ruled out (designated by an X) by the lack of observed change in clonal populations. (B) The evolutionary response results from selection of a rare clone (red) that “does the wrong thing,” that is, its plastic response is opposite of the common types in the population. (C) The evolutionary response results from selection of a clone in the extreme upper tail of the phenotypic distribution (cyan) with a plastic response in the same direction as the common types in the population. (D) Predicted plasticity when evolved populations are exposed to the original environment. The scenario depicted in (B) predicts the observed outcome, shown in red; the scenario depicted in (C) predicts the outcome not observed, depicted in cyan.

