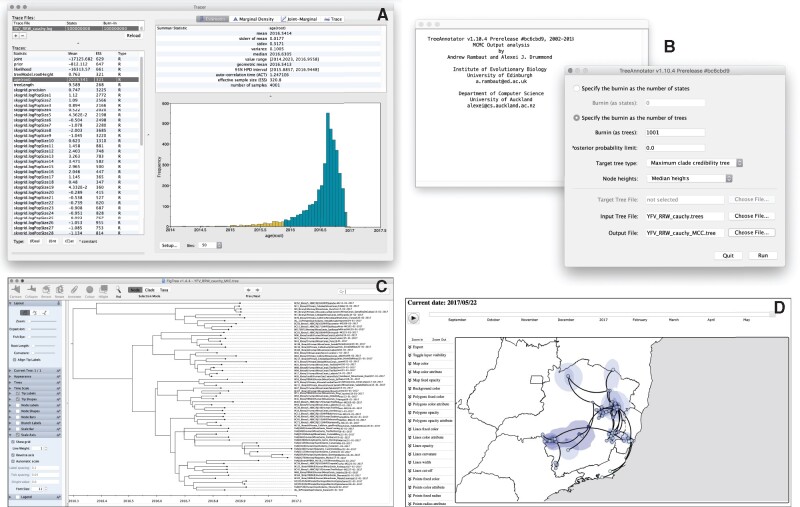
Fig. 3.
Analyzing the outputs of the continuous phylogeographic inference: assessing convergence and mixing with Tracer (A), summarizing the posterior trees by using TreeAnnotator to find and annotate the MCC tree (B), visualizing the resulting MCC tree with FigTree (C), and using spreaD3 to visualize the phylogeographic reconstruction (D). Zoomed versions of these figures can be found in our detailed online protocol: https://beast.community/workshop_continuous_diffusion_yfv.

