
Fig. 2.
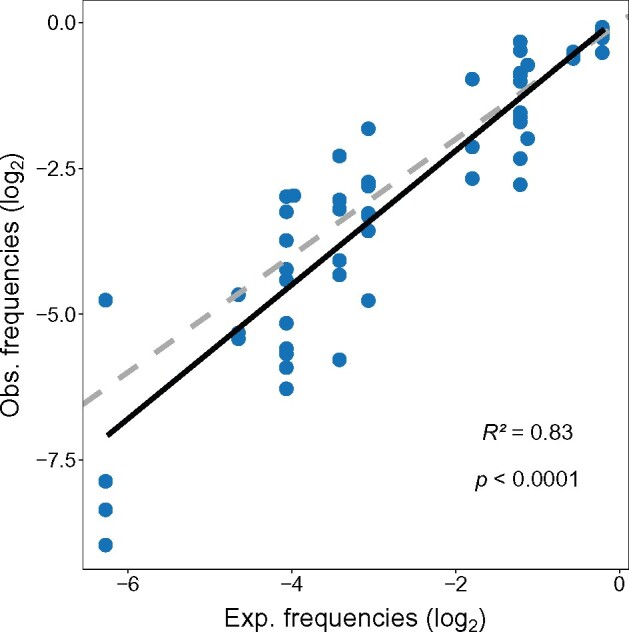
Base composition at mutational equilibrium (GCeq) explains most of the variation in the relative frequencies of synonymous codon usage (with both frequencies on a log2 scale). The solid line represents the best-fit relationship (from a regression of observed frequencies on expected, where intercept = 0.1 slope = 1.15), whereas the dashed line indicates the 1:1 relationship.