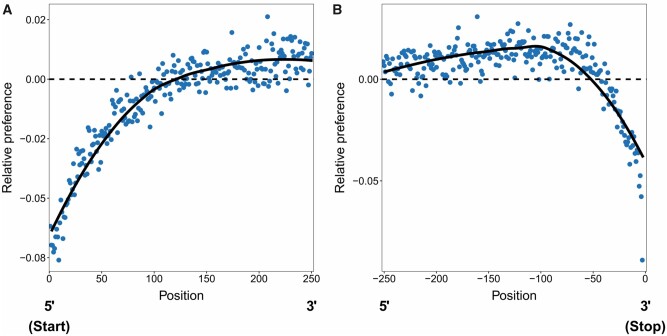
Fig. 5.
Patterns of codon preference across codon positions within genes. (A) the average relative codon preference starting from the beginning of genes, (B) and leading up to the stop codon (indicated by position zero, so negative positions are distances before the stop codon). In both plots, the lines represent splines (from an LOESS model), dashed lines represent the genome-wide average preference (zero), and the points represent the individual estimates at each codon position. Relative codon preference represents the average preference of codons present at each codon position relative to (i.e., as a deviation from) the genome-wide average (so a value of zero indicates a match to the genome-wide average, whereas negative values indicate preference below the overall average, etc.).

