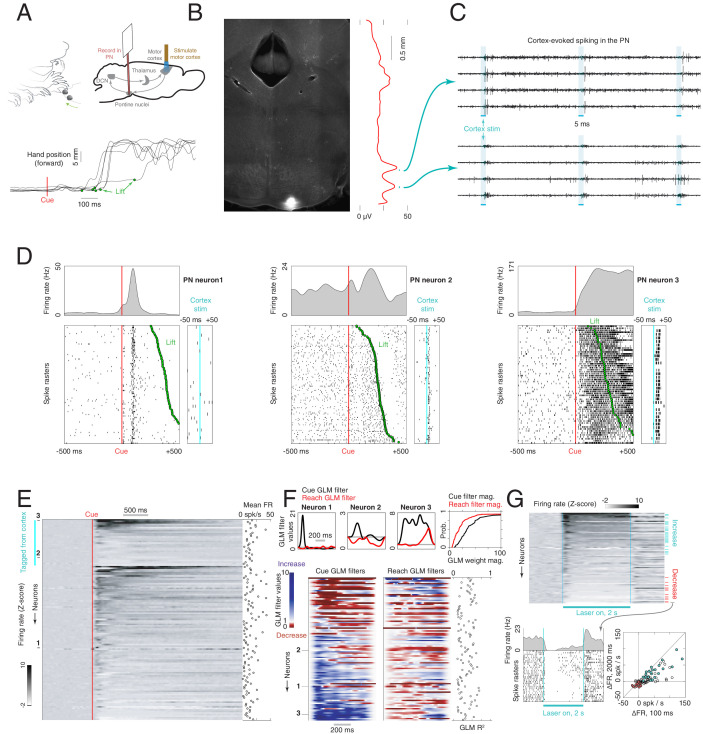
Figure 2. Firing properties of pontine nuclei (PN) neurons during a cortically dependent reach-to-grab task.
(A) Experimental setup and reach kinematics. Upper left: mice were head-fixed and trained to reach to and grab a pellet of food following an acoustic cue. Upper right: strategy for recording from motor-cortex-recipient neurons in the pontine nuclei. An optical fiber was placed over the forelimb motor cortex of mice expressing ChR2 in pyramidal tract neurons (Sim1-Cre X Ai32). A 384-channel Neuropixels probe was lowered into the pontine nuclei as a laser pulse train was delivered to cortex. After these stimuli were delivered, the animal performed the task as PN neurons were recorded. Lower: example hand trajectories aligned to the cue. The green dots indicate lift, when the animal initiates the reach-to-grab sequence. (B) Histological section showing the tip of the probe in the PN. Red line shows the amplitude of multiunit activity on the probe in response to cortical stimulation as a function of depth. (C) Raw data from eight channels near the bottom of the probe showing activity evoked in the PN by motor cortex stimulation. (D) Spike rasters and firing rates for example neurons in the task, aligned to the cue. The timing of lift is indicated by the green dots. The panels on the right show each unit’s response to cortical stimulation. (E) Firing rate z-scores for all PN neurons (n = 129), sorted according to whether the cells responded to cortical stimulation and by the magnitude of the response (n = 30 neurons were responsive). Inset at the right shows mean firing rates. (F) Effect of the cue and reaching on the firing rates of PN neurons (see Materials and methods). Upper: cue (black) and reach (red) components from generalized linear models (GLMs) for the three example neurons in (D). Gray horizontal lines at the value of 1 correspond to no effect on firing rate; values less than 1 correspond to a decrease, and values greater than 1 correspond to an increase. Lower: cue and reach components for all neurons with R2 > 0.1 (n = 103). Blue values indicate firing rate increases, and red values indicate decreases. Inset at right shows R2 for each neuron. (G) Response of PN neurons to a 2 s, 40 Hz stimulation of motor cortex. Upper: firing rate z-scores for each neuron, aligned to laser onset. Blue ticks indicate neurons with a sustained increase, and red ticks indicate neurons with a decrease. Lower left: laser-aligned spike rasters and firing rate for an example neuron suppressed by motor cortical stimulation. Lower right: scatterplot of the change in firing rate (FR) from baseline over the entire 2 s stimulation window vs. over the initial 100 ms of stimulation. Color coding as in the upper panel.


