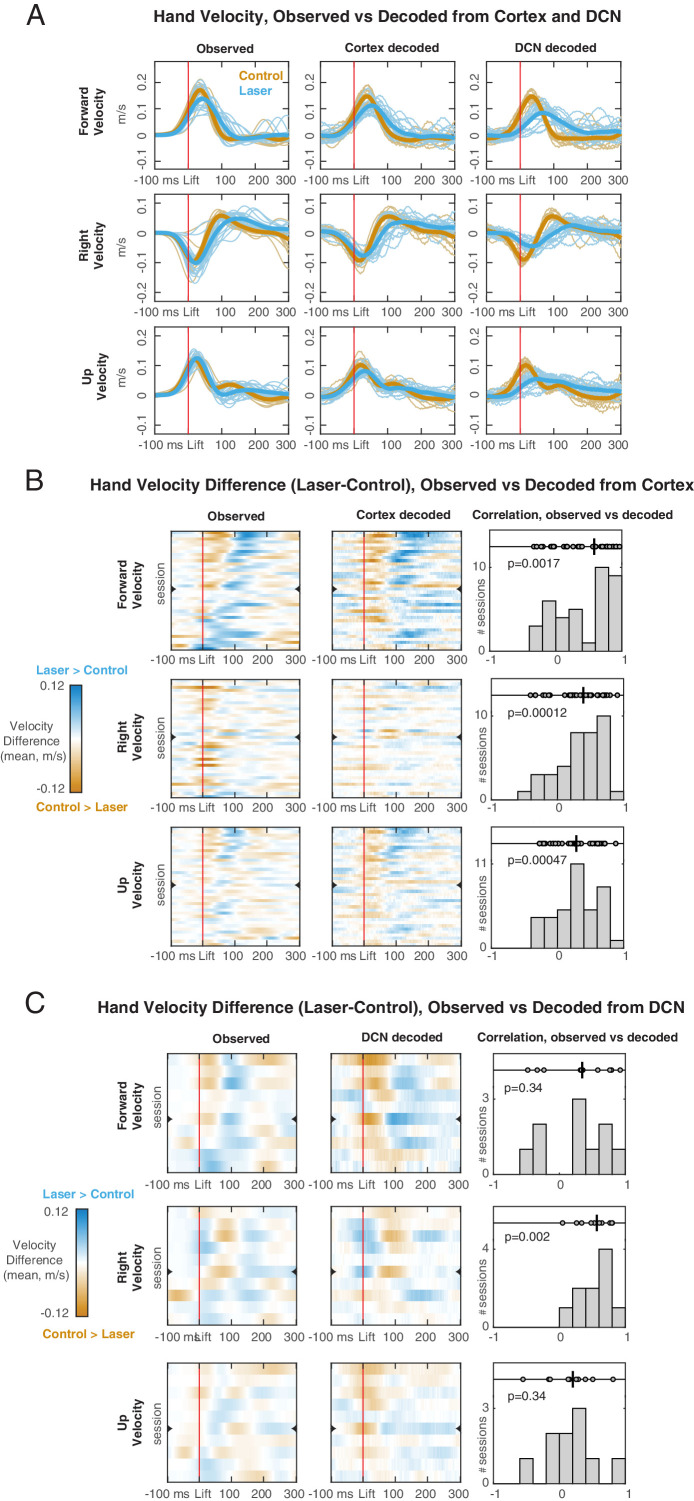
Figure 9. Hand velocity decoding from neural activity in motor cortex and deep cerebellar nuclei (DCN).
(A) Observed (left column) vs. decoded (center cortex, right DCN) velocity trajectories in each direction for a session with simultaneous recordings. Blue lines represent all trials with pontine nuclei (PN) perturbation (‘laser’) and their mean (thicker line). Orange lines represent all ‘test control’ trials, not used for training the decoder, and their mean. (B) Observed vs. decoded mean differences in velocity between laser and control test trials, for each of the sessions with cortical recordings (n = 38). In the heatmaps (left observed, center decoded) rows are sessions, ordered based on the observed mean velocity difference in the forward direction in the 100 ms following lift. Orange regions indicate time points in which the velocity is higher on control trials, and blue regions indicate points in which the velocity is higher on laser trials. The row denoted with a mark is the session shown in (A). Right panels show the distribution of rank correlations (Spearman’s ρ) between the observed and decoded differences in velocity over time (i.e., between corresponding rows of the heatmaps). Within each panel, individual correlations and their median (black line) are shown on top, with p-value of the two-sided sign rank test against the null hypothesis of zero median, and histogram of correlation values across sessions is shown at the bottom. (C) Same as (B), for each of the sessions with DCN recordings (n=10).


