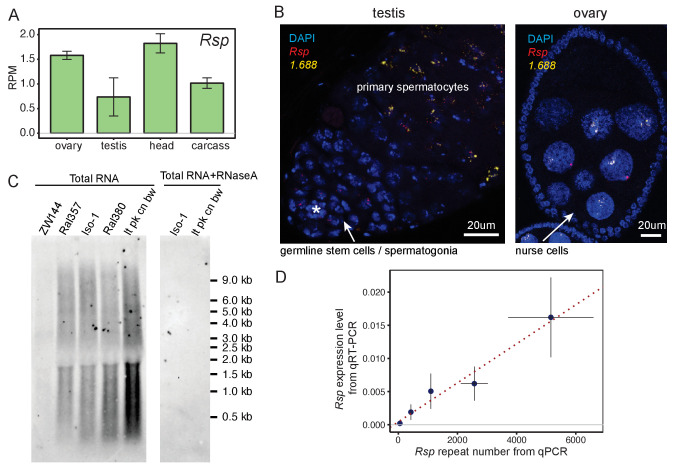
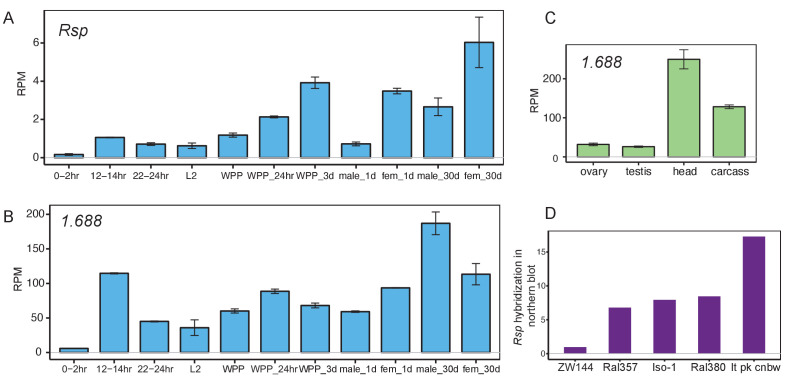
Figure 1. Satellite DNAs (satDNAs) are expressed in ovaries and testes.
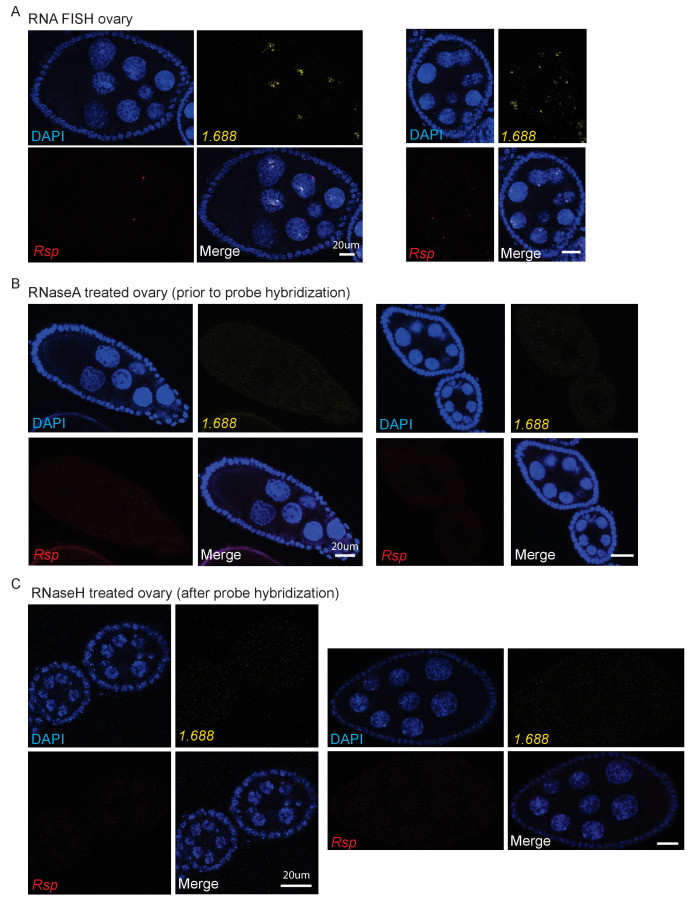
(A) Rsp satDNA transcription level in various tissues (corresponding result for 1.688 is shown in Figure 1—figure supplement 1C). Carcass: whole body without the head, reproductive organs, and digestive tract. Source data in Figure 1—source data 1. (B) RNA fluorescence in situ hybridization shows evidence for Rsp and 1.688-derived transcripts in testes and ovaries; asterisk indicates the hub. The probe for 1.688 recognizes all 1.688 subfamilies except for 260-bp on chromosome 2L. (C) Northern blot probed with Rsp. Total RNA was extracted from ovaries of fly lines with varying copy numbers of Rsp: ZW144 (200 copies), Ral357 (600 copies), Iso-1 (1100 copies), Ral380 (2300), and lt pk cn bw (4100). There is no signal after RNaseA treatment. Signal quantification (shown in Figure 1—figure supplement 1D) shows Rsp transcript abundance correlates with its genomic copy number (Pearson’s correlation coefficient r2 = 0.93, p-value=0.02). (D) qPCR and qRT-PCR quantification of Rsp copy number and expression level, respectively, of strains used in northern blot. A linear regression line is shown in the plot with red dotted line (Pearson’s correlation coefficient r2 = 0.98, p-value=0.003). Details for (C) and (D) in Supplementary file 4.


