. 2021 Jul 29;10:e70429. doi: 10.7554/eLife.70429

Figure 2. Transcriptomic pathway analysis of analog #4 reveals differentially expressed genes (DEGs) in tumor cells with mutant p53.

SW480 cells were treated with analog #4 for 12 hr. Three-way Venn diagram of all genes tested that met the low expression cutoff (pink), DEGs with an FDR<0.05 (purple), and the known p53 target gene set (A). Heatmap of DEGs that overlapped with the known p53 target gene set (B). Predictive transcription factor analysis according to direct binding motif was performed for all the DEGs (total genes 3362) (C). Four-way Venn diagram of DEGs with an FDR<0.05 (purple), and the known p53 target gene set from Table S3 of Fischer, 2017 (green), ATF4 gene set (yellow), and E2F gene set (pink) (D).

Figure 2—source data 1. Gene expression values of DMSO vehicle control and analog #4 SW480 treated cells at 12 hr samples analysed by microarray Affymetrix Human Gene 2.0-ST array probe set.
Figure 2—source data 2. Gene names from Figure 2A–B Venn diagram data sets containing all genes without the FDR of <0.05 filter, differentially expressed genes (DEG) with FDR of <0.05 filter and reference p53 data set from Fischer, 2017, Table S3.
elife-70429-fig2-data2.xlsx (354.7KB, xlsx)

Figure 2.

Figure 2—figure supplement 1. Transcriptomic analysis quality control principal component (PC) plots and false discovery rate (FDR) bar graph.

Figure 2—figure supplement 1.

PC1 accounts for the highest variability factor being the differences between control and analog #4 treatment. Statistically significant changes in gene expression were determined as FDR<0.05.
Figure 2—figure supplement 2. Kyoto Encyclopedia of Genes and Genomes (KEGG) for the p53-pathway signaling.

Figure 2—figure supplement 2.

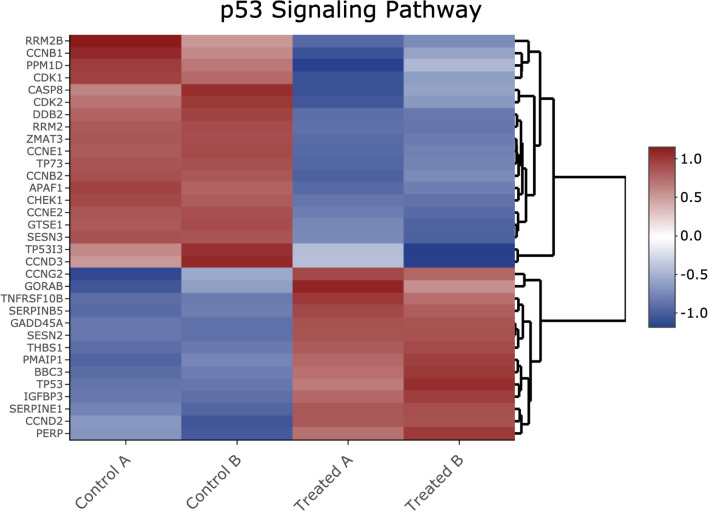
Analog #4 differentially regulated genes that overlapped with the known p53 target gene set were used to perform a KEGG analysis for the p53 pathway.
Figure 2—figure supplement 3. Heatmap of genes shown in Figure 2—figure supplement 2 Kyoto Encyclopedia of Genes and Genomes (KEGG) p53-pathway signaling analysis.

Figure 2—figure supplement 3.

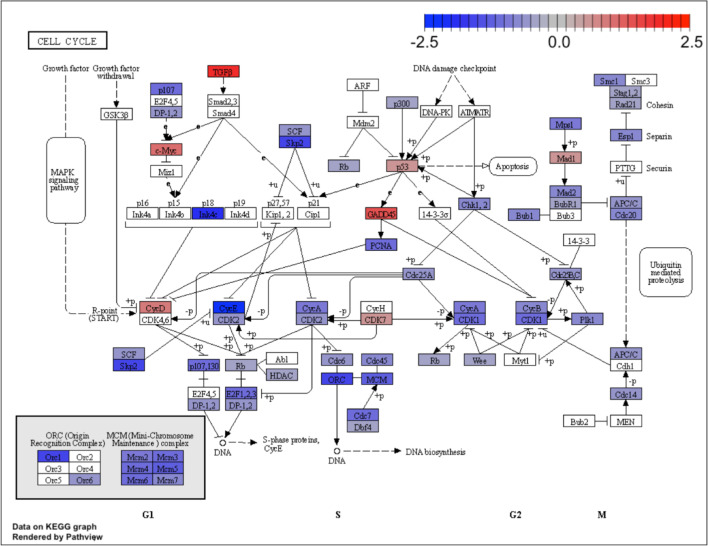
Figure 2—figure supplement 4. Kyoto Encyclopedia of Genes and Genomes (KEGG) for the cell cycle pathway.

Figure 2—figure supplement 4.

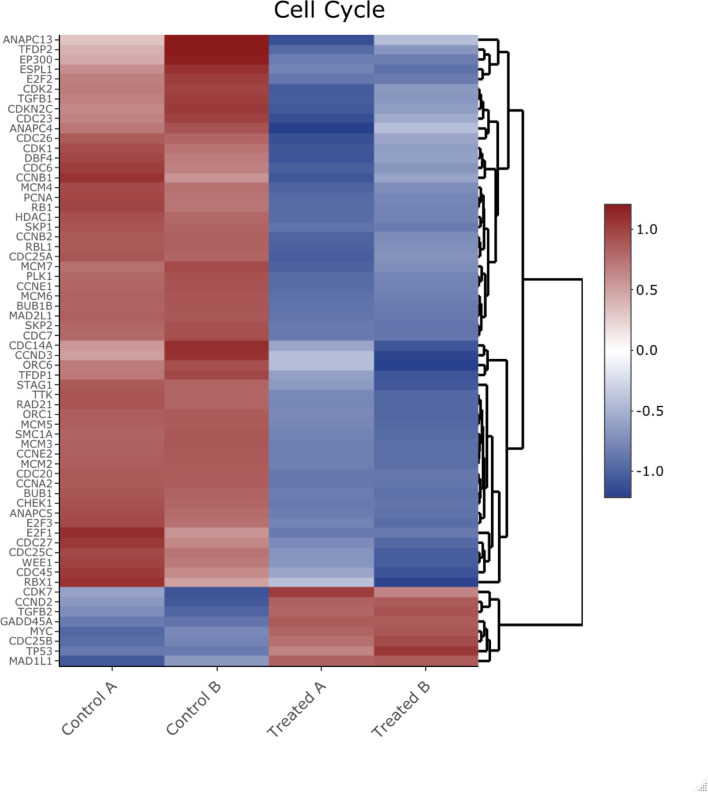
KEGG analysis of analog #4 differentially regulated genes was found to be enriched for the cell cycle pathway, adjp equal to 2.27×10⁻⁶.
Figure 2—figure supplement 5. Heatmap of genes shown in Figure 2—figure supplement 4 Kyoto Encyclopedia of Genes and Genomes analysis from the cell cycle pathway.

Figure 2—figure supplement 5.

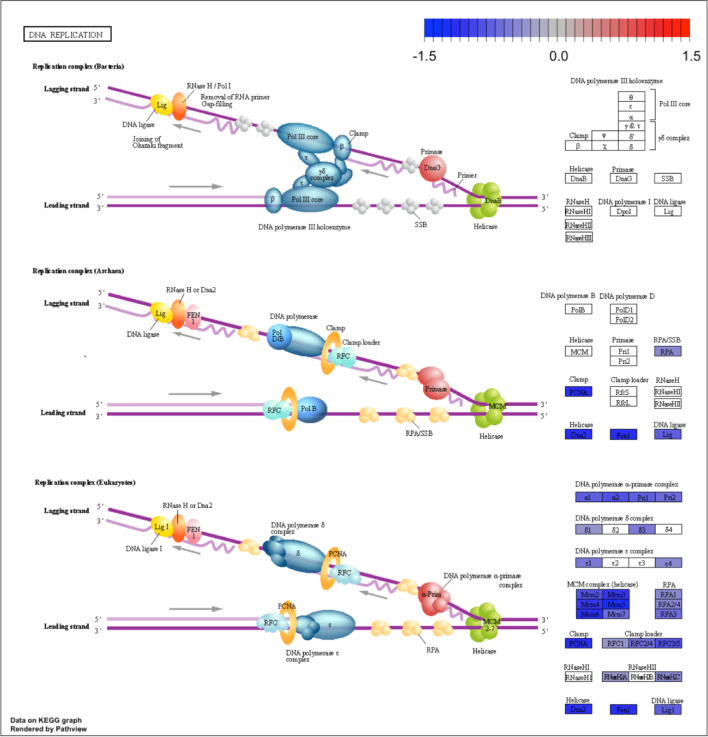
Figure 2—figure supplement 6. Kyoto Encyclopedia of Genes and Genomes (KEGG) for the DNA replication pathway.

Figure 2—figure supplement 6.

KEGG analysis of analog #4 differentially regulated genes was found to be enriched for the DNA replication pathway, adjp equal to 2.27×10⁻⁶.
Figure 2—figure supplement 7. Heatmap of genes shown in Figure 2—figure supplement 6 Kyoto Encyclopedia of Genes and Genomes analysis from the DNA replication pathway.

Figure 2—figure supplement 7.

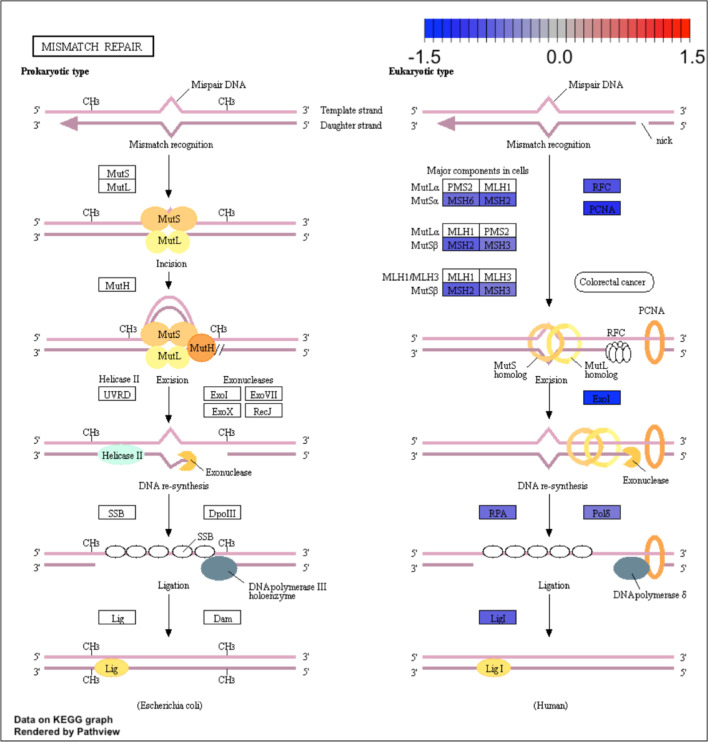
Figure 2—figure supplement 8. Kyoto Encyclopedia of Genes and Genomes (KEGG) for the mismatch repair pathway.

Figure 2—figure supplement 8.

KEGG analysis of analog #4 differentially regulated genes was found to be enriched for the DNA replication pathway, adjp equal 5.05×10⁻³.
Figure 2—figure supplement 9. Heatmap of genes shown in Figure 2—figure supplement 8 Kyoto Encyclopedia of Genes and Genomes analysis from the mismatch repair pathway.

Figure 2—figure supplement 9.

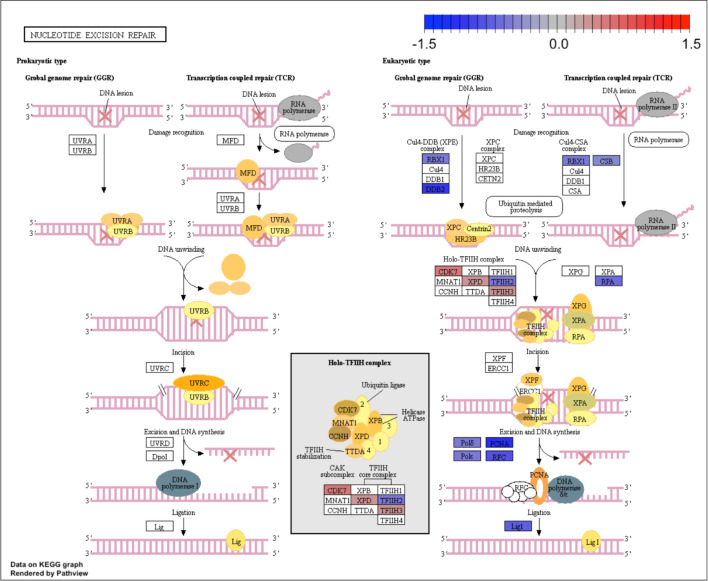
Figure 2—figure supplement 10. Kyoto Encyclopedia of Genes and Genomes (KEGG) for the nucleotide excision repair pathway.

Figure 2—figure supplement 10.

KEGG analysis of analog #4 differentially regulated genes was found to be enriched for the DNA replication pathway, adjp equal 2.18×10⁻².
Figure 2—figure supplement 11. Heatmap of genes shown in Figure 2—figure supplement 10 Kyoto Encyclopedia of Genes and Genomes analysis from the nucleotide excision repair pathway.

Figure 2—figure supplement 11.