. 2021 Jul 29;10:e70429. doi: 10.7554/eLife.70429

Figure 3. Proteomic pathway analysis of CB002-analog #4 responsive differentially expressed proteins in SW480 cells.

Significantly enriched pathways corresponding to the CB002-analog #4 responsive upregulated (A) and downregulated (B) proteins (in comparison with the DMSO). The heatmap (C) shows the grouped proteins’ expression value of some target pathway proteins highlighted in the box area. Data collected from the proteomic analysis of DMSO versus CB002 and analog #4 treated SW480 cell samples for 24 hr.

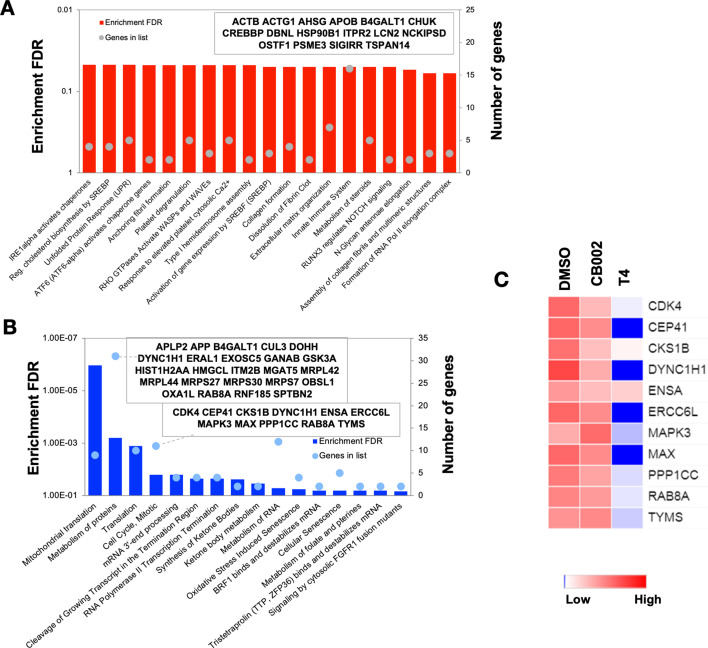
Figure 3—source data 1. Protein information of all proteins detected in DMSO vehicle control and analog #4 SW480 treated cells at 24 hr samples analysed by LC-MS/MS.

Figure 3.

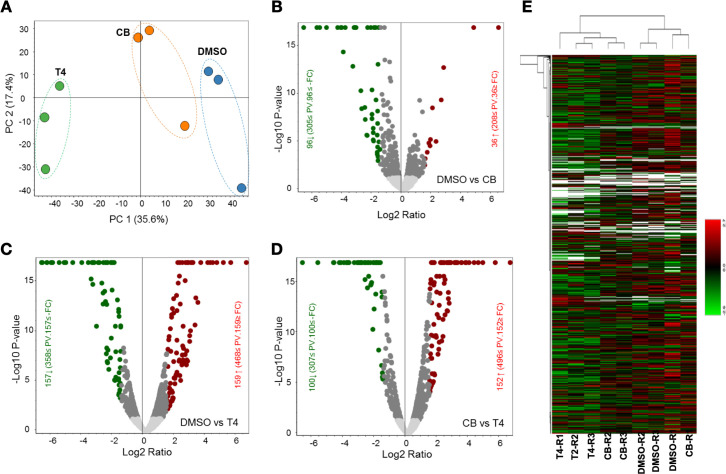
Figure 3—figure supplement 1. Comparative label-free quantitative proteomic analysis of SW480 cell lines in response to DMSO, CB002 (CB), and analog 4 (T4) treated for 24 hr.

Figure 3—figure supplement 1.

(A) Principal component analysis of total protein abundance data collected from DMSO, CB002 (CB), and analog 4 (T4) samples. Data represents the close clustering of protein abundance of each replicates under the same group, however, showed variability among the treatments. (B–D) Volcano plot of fold change versus q-value of the total of 3743 proteins quantified from SW480 cell lines in response to DMSO, CB, and T4 treatments. Red and green circles represent the significant (q<0.05) upregulated and down-regulated proteins. Gray circles (q=0.05) are non-significant and below the threshold of fold expression. (E) Heat map and clustering analysis of the total proteins (3743) identified from DMSO, CB, and T4 samples.