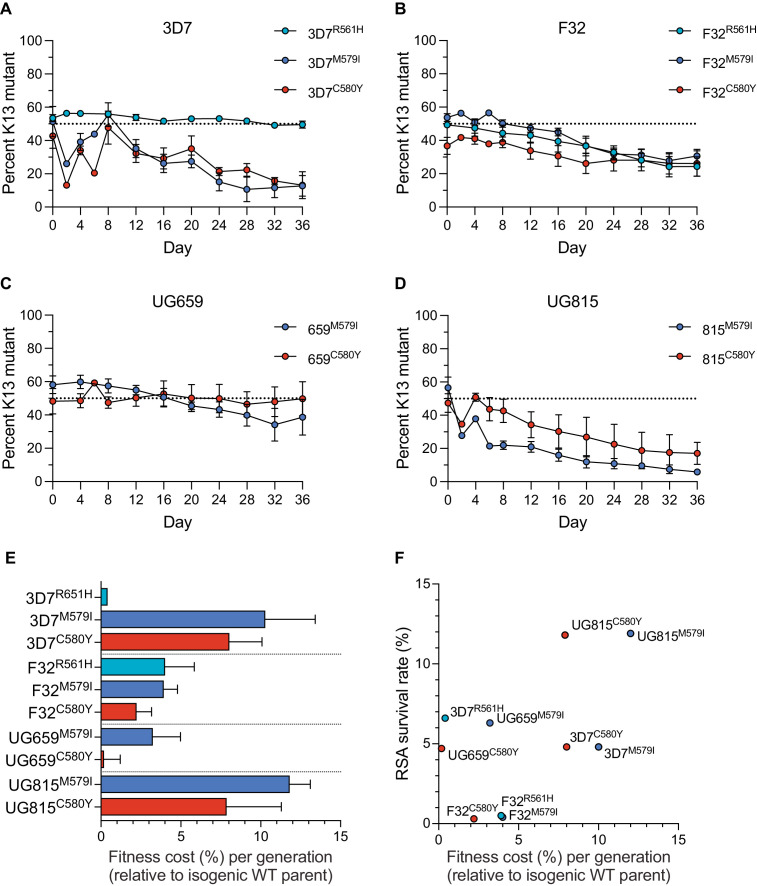
Figure 3. K13 mutations cause differential impacts on in vitro growth rates across gene-edited African strains.
(A–D) Percentages of mutant alleles relative to the wild-type allele over time in (A) 3D7, (B) F32, (C) UG659, and (D) UG815 parasite cultures in which K13 mutant clones were co-cultured at 1:1 starting ratios with isogenic K13 wild-type controls over a period of 36 days. Results, shown as means ± SEM, were obtained from two to five independent experiments, each performed in duplicate. Values are provided in Figure 3—source data 1. (E) The percent reduction in growth rate per 48 hr generation, termed the fitness cost, is presented as mean ± SEM for each mutant line relative to its isogenic wild-type comparator. (F) Fitness costs for mutant lines and isogenic wild-type comparators plotted relative to RSA survival values for the same lines.

