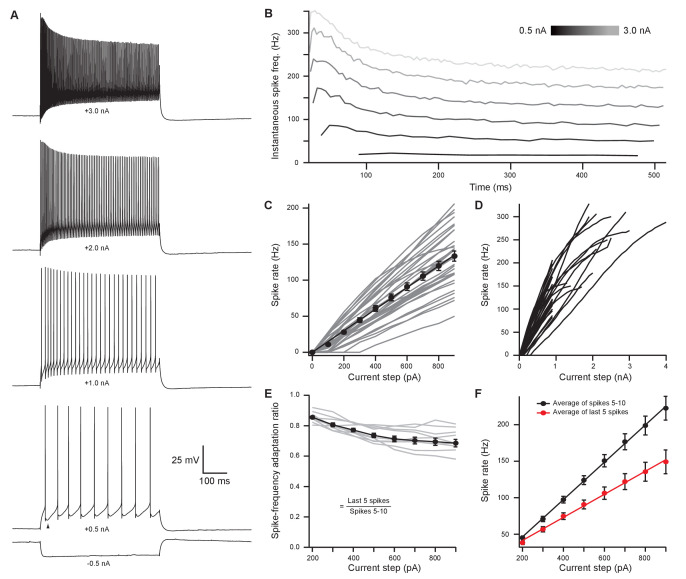
Figure 2. Medial olivocochlear neurons accurately encoded stimulus intensity and duration.
(A) Whole-cell current-clamp recording example of medial olivocochlear (MOC) neuron voltage responses to current injections. Black arrowhead illustrates a double undershoot after-hyperpolarization waveform often observed at action potential threshold-level current injection and is characteristic of MOC neurons. (B) Example of the instantaneous spike rate over time at increasing current injections from the same neuron in (A). Current steps begin at 0.5 nA and increase to 3.0 nA in 0.5 nA steps. (C) Mean spike rate during 500-ms current injections of increasing intensity (N = 33). Averages for current injections up to 900 pA demonstrated a linear input-output curve. A linear function was fit to the mean data, and the y-intercept was forced to 0 pA (, r2 = 0.972). (D) Same neurons from (C), with current injections up to 4 nA. (E) The ratio of spike-rate adaptation during the last five spikes compared to spikes #1–5 (N = 11). Analysis was not performed on current steps below 200 pA for panels (E) and (F), as no MOC neuron met the minimum requirement of 15 action potentials at those current intensities. (F) The mean spike rate of spikes #5–10 and the mean spike rate of the last five spikes. All error bars are ± SEM (N = 11). Linear functions were fit to the average spike rate of spikes #5–10 (, r2 = 0.999) and the average spike rate of the last five spikes (, r2 = 0.997).

